Immigrants from Nigeria vs Vietnamese Unemployment
COMPARE
Immigrants from Nigeria
Vietnamese
Unemployment
Unemployment Comparison
Immigrants from Nigeria
Vietnamese
5.8%
UNEMPLOYMENT
0.1/ 100
METRIC RATING
267th/ 347
METRIC RANK
6.5%
UNEMPLOYMENT
0.0/ 100
METRIC RATING
309th/ 347
METRIC RANK
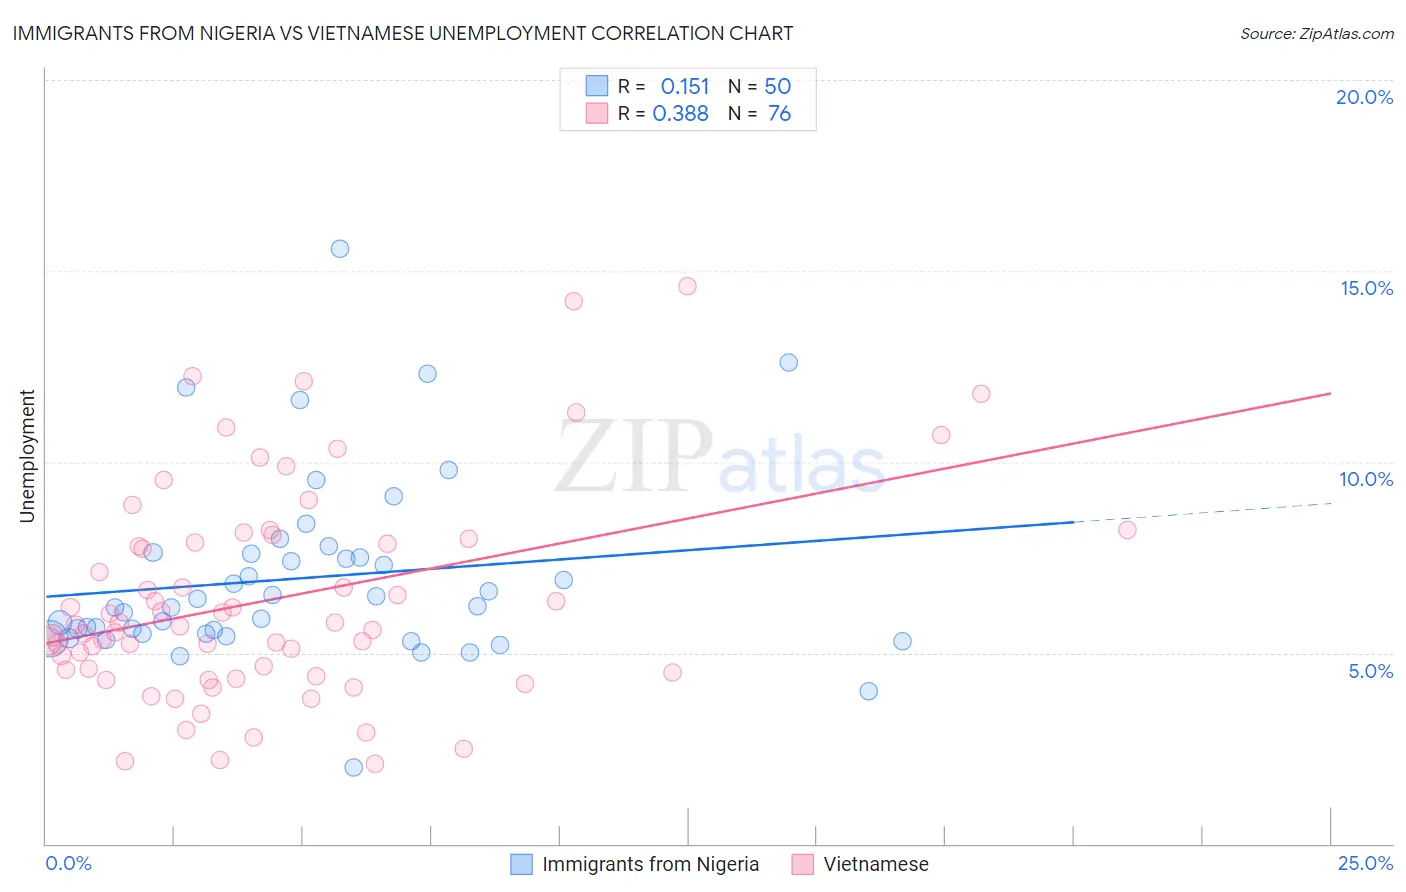
Immigrants from Nigeria vs Vietnamese Unemployment Correlation Chart
The statistical analysis conducted on geographies consisting of 283,412,431 people shows a poor positive correlation between the proportion of Immigrants from Nigeria and unemployment in the United States with a correlation coefficient (R) of 0.151 and weighted average of 5.8%. Similarly, the statistical analysis conducted on geographies consisting of 170,737,868 people shows a mild positive correlation between the proportion of Vietnamese and unemployment in the United States with a correlation coefficient (R) of 0.388 and weighted average of 6.5%, a difference of 11.3%.
Unemployment Correlation Summary
| Measurement | Immigrants from Nigeria | Vietnamese |
| Minimum | 2.0% | 2.1% |
| Maximum | 15.6% | 14.6% |
| Range | 13.6% | 12.5% |
| Mean | 7.0% | 6.4% |
| Median | 6.2% | 5.7% |
| Interquartile 25% (IQ1) | 5.5% | 4.5% |
| Interquartile 75% (IQ3) | 7.6% | 8.0% |
| Interquartile Range (IQR) | 2.1% | 3.4% |
| Standard Deviation (Sample) | 2.4% | 2.8% |
| Standard Deviation (Population) | 2.4% | 2.8% |
Similar Demographics by Unemployment
Demographics Similar to Immigrants from Nigeria by Unemployment
In terms of unemployment, the demographic groups most similar to Immigrants from Nigeria are Immigrants from Sierra Leone (5.8%, a difference of 0.040%), Immigrants from El Salvador (5.8%, a difference of 0.050%), Mexican American Indian (5.8%, a difference of 0.070%), Blackfeet (5.8%, a difference of 0.13%), and Mexican (5.9%, a difference of 0.36%).
| Demographics | Rating | Rank | Unemployment |
| Immigrants | Uzbekistan | 0.1 /100 | #260 | Tragic 5.8% |
| Immigrants | Guatemala | 0.1 /100 | #261 | Tragic 5.8% |
| Sierra Leoneans | 0.1 /100 | #262 | Tragic 5.8% |
| Salvadorans | 0.1 /100 | #263 | Tragic 5.8% |
| Immigrants | Liberia | 0.1 /100 | #264 | Tragic 5.8% |
| Nigerians | 0.1 /100 | #265 | Tragic 5.8% |
| Mexican American Indians | 0.1 /100 | #266 | Tragic 5.8% |
| Immigrants | Nigeria | 0.1 /100 | #267 | Tragic 5.8% |
| Immigrants | Sierra Leone | 0.1 /100 | #268 | Tragic 5.8% |
| Immigrants | El Salvador | 0.1 /100 | #269 | Tragic 5.8% |
| Blackfeet | 0.1 /100 | #270 | Tragic 5.8% |
| Mexicans | 0.1 /100 | #271 | Tragic 5.9% |
| Hispanics or Latinos | 0.0 /100 | #272 | Tragic 5.9% |
| Immigrants | Fiji | 0.0 /100 | #273 | Tragic 5.9% |
| Bahamians | 0.0 /100 | #274 | Tragic 5.9% |
Demographics Similar to Vietnamese by Unemployment
In terms of unemployment, the demographic groups most similar to Vietnamese are Barbadian (6.5%, a difference of 0.010%), Immigrants from Belize (6.5%, a difference of 0.27%), Immigrants from Bangladesh (6.5%, a difference of 0.38%), Cape Verdean (6.5%, a difference of 0.60%), and Lumbee (6.4%, a difference of 0.87%).
| Demographics | Rating | Rank | Unemployment |
| West Indians | 0.0 /100 | #302 | Tragic 6.4% |
| Belizeans | 0.0 /100 | #303 | Tragic 6.4% |
| Immigrants | Jamaica | 0.0 /100 | #304 | Tragic 6.4% |
| Menominee | 0.0 /100 | #305 | Tragic 6.4% |
| Lumbee | 0.0 /100 | #306 | Tragic 6.4% |
| Immigrants | Bangladesh | 0.0 /100 | #307 | Tragic 6.5% |
| Barbadians | 0.0 /100 | #308 | Tragic 6.5% |
| Vietnamese | 0.0 /100 | #309 | Tragic 6.5% |
| Immigrants | Belize | 0.0 /100 | #310 | Tragic 6.5% |
| Cape Verdeans | 0.0 /100 | #311 | Tragic 6.5% |
| Colville | 0.0 /100 | #312 | Tragic 6.6% |
| Immigrants | Barbados | 0.0 /100 | #313 | Tragic 6.6% |
| Blacks/African Americans | 0.0 /100 | #314 | Tragic 6.6% |
| Houma | 0.0 /100 | #315 | Tragic 6.7% |
| Immigrants | Dominica | 0.0 /100 | #316 | Tragic 6.7% |