Cypriot vs American Unemployment
COMPARE
Cypriot
American
Unemployment
Unemployment Comparison
Cypriots
Americans
4.9%
UNEMPLOYMENT
97.9/ 100
METRIC RATING
77th/ 347
METRIC RANK
5.0%
UNEMPLOYMENT
94.3/ 100
METRIC RATING
101st/ 347
METRIC RANK
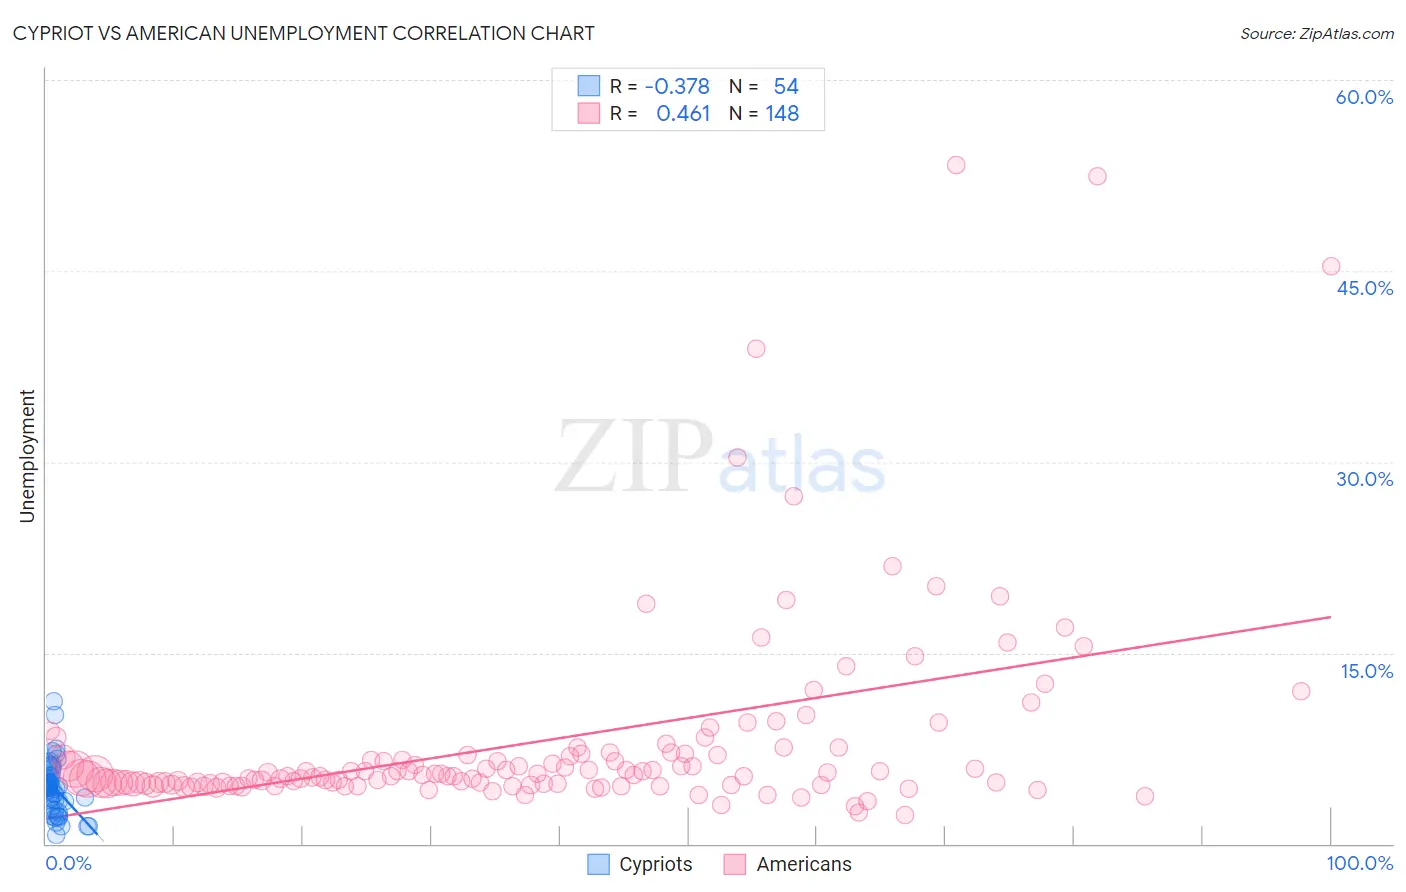
Cypriot vs American Unemployment Correlation Chart
The statistical analysis conducted on geographies consisting of 61,864,376 people shows a mild negative correlation between the proportion of Cypriots and unemployment in the United States with a correlation coefficient (R) of -0.378 and weighted average of 4.9%. Similarly, the statistical analysis conducted on geographies consisting of 576,683,680 people shows a moderate positive correlation between the proportion of Americans and unemployment in the United States with a correlation coefficient (R) of 0.461 and weighted average of 5.0%, a difference of 1.7%.
Unemployment Correlation Summary
| Measurement | Cypriot | American |
| Minimum | 0.70% | 2.2% |
| Maximum | 11.2% | 53.3% |
| Range | 10.5% | 51.1% |
| Mean | 4.4% | 8.0% |
| Median | 4.4% | 5.4% |
| Interquartile 25% (IQ1) | 3.3% | 4.7% |
| Interquartile 75% (IQ3) | 5.4% | 7.0% |
| Interquartile Range (IQR) | 2.1% | 2.3% |
| Standard Deviation (Sample) | 2.0% | 8.0% |
| Standard Deviation (Population) | 2.0% | 8.0% |
Similar Demographics by Unemployment
Demographics Similar to Cypriots by Unemployment
In terms of unemployment, the demographic groups most similar to Cypriots are Okinawan (4.9%, a difference of 0.040%), German Russian (4.9%, a difference of 0.060%), Turkish (4.9%, a difference of 0.080%), Canadian (5.0%, a difference of 0.16%), and Immigrants from Northern Europe (4.9%, a difference of 0.22%).
| Demographics | Rating | Rank | Unemployment |
| Serbians | 98.4 /100 | #70 | Exceptional 4.9% |
| Immigrants | Japan | 98.3 /100 | #71 | Exceptional 4.9% |
| Burmese | 98.3 /100 | #72 | Exceptional 4.9% |
| Paraguayans | 98.3 /100 | #73 | Exceptional 4.9% |
| Immigrants | Northern Europe | 98.2 /100 | #74 | Exceptional 4.9% |
| Turks | 98.0 /100 | #75 | Exceptional 4.9% |
| German Russians | 98.0 /100 | #76 | Exceptional 4.9% |
| Cypriots | 97.9 /100 | #77 | Exceptional 4.9% |
| Okinawans | 97.9 /100 | #78 | Exceptional 4.9% |
| Canadians | 97.7 /100 | #79 | Exceptional 5.0% |
| Immigrants | Sweden | 97.6 /100 | #80 | Exceptional 5.0% |
| Basques | 97.6 /100 | #81 | Exceptional 5.0% |
| Fijians | 97.6 /100 | #82 | Exceptional 5.0% |
| Hmong | 97.6 /100 | #83 | Exceptional 5.0% |
| Russians | 97.4 /100 | #84 | Exceptional 5.0% |
Demographics Similar to Americans by Unemployment
In terms of unemployment, the demographic groups most similar to Americans are Immigrants from Argentina (5.0%, a difference of 0.050%), Chickasaw (5.0%, a difference of 0.080%), Osage (5.0%, a difference of 0.080%), Maltese (5.0%, a difference of 0.090%), and Estonian (5.0%, a difference of 0.10%).
| Demographics | Rating | Rank | Unemployment |
| Immigrants | Austria | 95.9 /100 | #94 | Exceptional 5.0% |
| Immigrants | Serbia | 95.6 /100 | #95 | Exceptional 5.0% |
| Immigrants | England | 95.2 /100 | #96 | Exceptional 5.0% |
| Immigrants | Czechoslovakia | 95.1 /100 | #97 | Exceptional 5.0% |
| Romanians | 95.0 /100 | #98 | Exceptional 5.0% |
| Mongolians | 94.8 /100 | #99 | Exceptional 5.0% |
| Estonians | 94.6 /100 | #100 | Exceptional 5.0% |
| Americans | 94.3 /100 | #101 | Exceptional 5.0% |
| Immigrants | Argentina | 94.1 /100 | #102 | Exceptional 5.0% |
| Chickasaw | 94.0 /100 | #103 | Exceptional 5.0% |
| Osage | 94.0 /100 | #104 | Exceptional 5.0% |
| Maltese | 94.0 /100 | #105 | Exceptional 5.0% |
| Immigrants | Romania | 93.7 /100 | #106 | Exceptional 5.0% |
| Immigrants | Turkey | 93.7 /100 | #107 | Exceptional 5.0% |
| Immigrants | Kuwait | 93.7 /100 | #108 | Exceptional 5.0% |