Immigrants from Morocco vs Alaskan Athabascan Unemployment
COMPARE
Immigrants from Morocco
Alaskan Athabascan
Unemployment
Unemployment Comparison
Immigrants from Morocco
Alaskan Athabascans
5.2%
UNEMPLOYMENT
59.1/ 100
METRIC RATING
169th/ 347
METRIC RANK
7.7%
UNEMPLOYMENT
0.0/ 100
METRIC RATING
335th/ 347
METRIC RANK
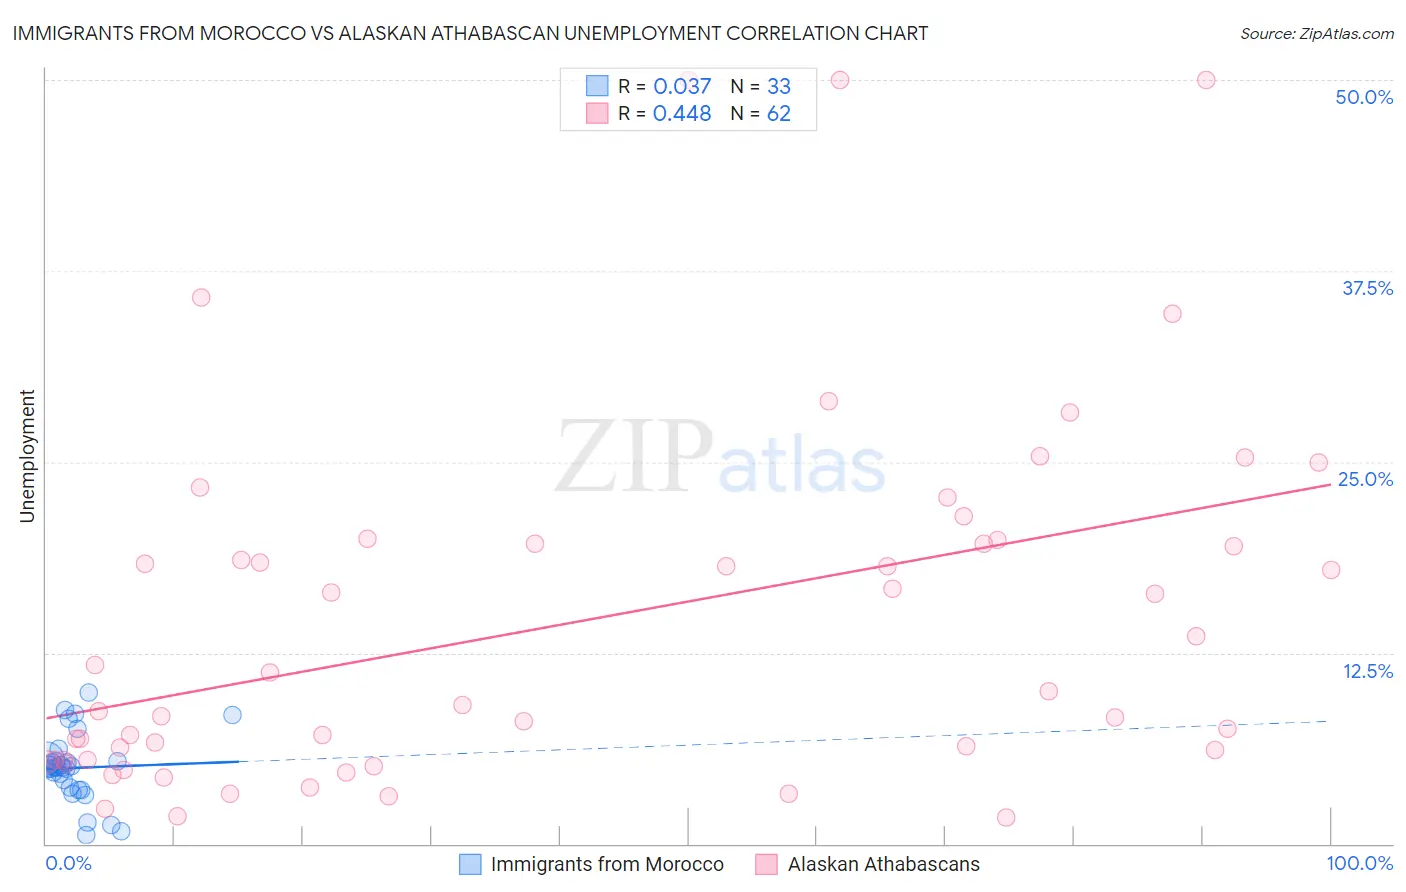
Immigrants from Morocco vs Alaskan Athabascan Unemployment Correlation Chart
The statistical analysis conducted on geographies consisting of 178,898,527 people shows no correlation between the proportion of Immigrants from Morocco and unemployment in the United States with a correlation coefficient (R) of 0.037 and weighted average of 5.2%. Similarly, the statistical analysis conducted on geographies consisting of 45,810,062 people shows a moderate positive correlation between the proportion of Alaskan Athabascans and unemployment in the United States with a correlation coefficient (R) of 0.448 and weighted average of 7.7%, a difference of 46.4%.
Unemployment Correlation Summary
| Measurement | Immigrants from Morocco | Alaskan Athabascan |
| Minimum | 0.60% | 1.7% |
| Maximum | 9.9% | 50.0% |
| Range | 9.3% | 48.3% |
| Mean | 5.0% | 14.5% |
| Median | 5.0% | 9.6% |
| Interquartile 25% (IQ1) | 3.6% | 5.5% |
| Interquartile 75% (IQ3) | 5.4% | 19.6% |
| Interquartile Range (IQR) | 1.8% | 14.1% |
| Standard Deviation (Sample) | 2.2% | 11.8% |
| Standard Deviation (Population) | 2.2% | 11.7% |
Similar Demographics by Unemployment
Demographics Similar to Immigrants from Morocco by Unemployment
In terms of unemployment, the demographic groups most similar to Immigrants from Morocco are Uruguayan (5.2%, a difference of 0.070%), Immigrants from Nicaragua (5.2%, a difference of 0.12%), Colombian (5.2%, a difference of 0.13%), Immigrants from Indonesia (5.2%, a difference of 0.14%), and Puget Sound Salish (5.2%, a difference of 0.16%).
| Demographics | Rating | Rank | Unemployment |
| Spanish | 65.1 /100 | #162 | Good 5.2% |
| Immigrants | Zaire | 64.7 /100 | #163 | Good 5.2% |
| Immigrants | Colombia | 64.7 /100 | #164 | Good 5.2% |
| Immigrants | Brazil | 63.1 /100 | #165 | Good 5.2% |
| Immigrants | Indonesia | 61.2 /100 | #166 | Good 5.2% |
| Colombians | 61.1 /100 | #167 | Good 5.2% |
| Uruguayans | 60.2 /100 | #168 | Good 5.2% |
| Immigrants | Morocco | 59.1 /100 | #169 | Average 5.2% |
| Immigrants | Nicaragua | 57.1 /100 | #170 | Average 5.2% |
| Puget Sound Salish | 56.6 /100 | #171 | Average 5.2% |
| Immigrants | Vietnam | 52.5 /100 | #172 | Average 5.2% |
| Immigrants | Poland | 51.8 /100 | #173 | Average 5.3% |
| Immigrants | Congo | 50.0 /100 | #174 | Average 5.3% |
| Taiwanese | 49.6 /100 | #175 | Average 5.3% |
| Nicaraguans | 48.7 /100 | #176 | Average 5.3% |
Demographics Similar to Alaskan Athabascans by Unemployment
In terms of unemployment, the demographic groups most similar to Alaskan Athabascans are Immigrants from Yemen (7.7%, a difference of 0.72%), Apache (7.4%, a difference of 3.0%), Immigrants from Dominican Republic (7.4%, a difference of 3.5%), Sioux (7.4%, a difference of 3.6%), and Dominican (7.4%, a difference of 4.0%).
| Demographics | Rating | Rank | Unemployment |
| Tsimshian | 0.0 /100 | #328 | Tragic 7.2% |
| Alaska Natives | 0.0 /100 | #329 | Tragic 7.2% |
| Yakama | 0.0 /100 | #330 | Tragic 7.3% |
| Dominicans | 0.0 /100 | #331 | Tragic 7.4% |
| Sioux | 0.0 /100 | #332 | Tragic 7.4% |
| Immigrants | Dominican Republic | 0.0 /100 | #333 | Tragic 7.4% |
| Apache | 0.0 /100 | #334 | Tragic 7.4% |
| Alaskan Athabascans | 0.0 /100 | #335 | Tragic 7.7% |
| Immigrants | Yemen | 0.0 /100 | #336 | Tragic 7.7% |
| Cheyenne | 0.0 /100 | #337 | Tragic 8.0% |
| Pima | 0.0 /100 | #338 | Tragic 8.2% |
| Navajo | 0.0 /100 | #339 | Tragic 8.4% |
| Puerto Ricans | 0.0 /100 | #340 | Tragic 8.4% |
| Tohono O'odham | 0.0 /100 | #341 | Tragic 8.9% |
| Hopi | 0.0 /100 | #342 | Tragic 8.9% |