Scottish vs Alaskan Athabascan Unemployment
COMPARE
Scottish
Alaskan Athabascan
Unemployment
Unemployment Comparison
Scottish
Alaskan Athabascans
4.7%
UNEMPLOYMENT
99.9/ 100
METRIC RATING
19th/ 347
METRIC RANK
7.7%
UNEMPLOYMENT
0.0/ 100
METRIC RATING
335th/ 347
METRIC RANK
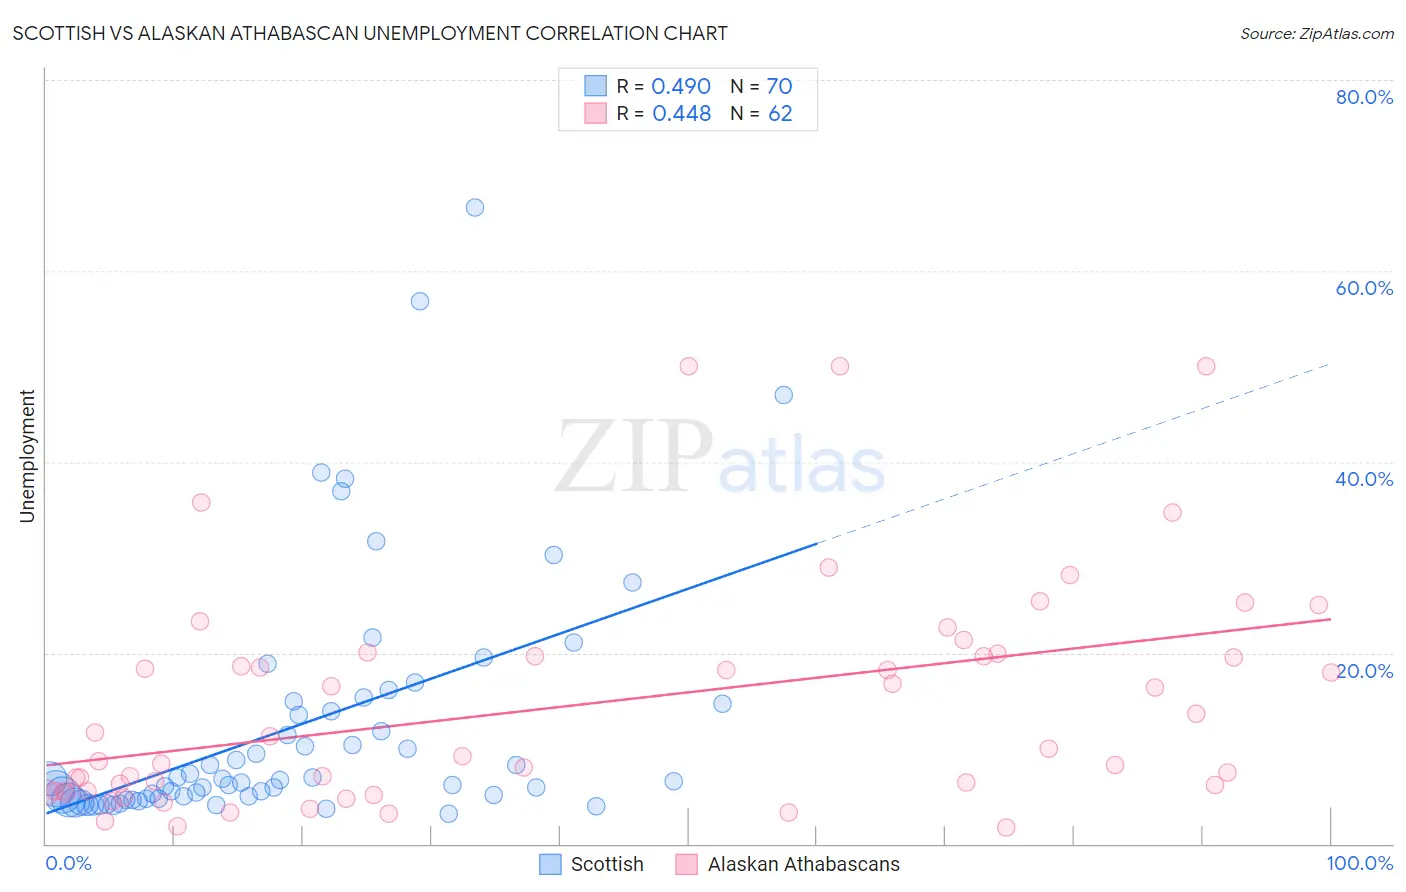
Scottish vs Alaskan Athabascan Unemployment Correlation Chart
The statistical analysis conducted on geographies consisting of 563,082,415 people shows a moderate positive correlation between the proportion of Scottish and unemployment in the United States with a correlation coefficient (R) of 0.490 and weighted average of 4.7%. Similarly, the statistical analysis conducted on geographies consisting of 45,810,062 people shows a moderate positive correlation between the proportion of Alaskan Athabascans and unemployment in the United States with a correlation coefficient (R) of 0.448 and weighted average of 7.7%, a difference of 64.1%.
Unemployment Correlation Summary
| Measurement | Scottish | Alaskan Athabascan |
| Minimum | 3.2% | 1.7% |
| Maximum | 66.7% | 50.0% |
| Range | 63.5% | 48.3% |
| Mean | 12.3% | 14.5% |
| Median | 6.6% | 9.6% |
| Interquartile 25% (IQ1) | 4.8% | 5.5% |
| Interquartile 75% (IQ3) | 14.7% | 19.6% |
| Interquartile Range (IQR) | 9.9% | 14.1% |
| Standard Deviation (Sample) | 12.9% | 11.8% |
| Standard Deviation (Population) | 12.8% | 11.7% |
Similar Demographics by Unemployment
Demographics Similar to Scottish by Unemployment
In terms of unemployment, the demographic groups most similar to Scottish are Immigrants from Venezuela (4.7%, a difference of 0.080%), Slovene (4.7%, a difference of 0.10%), Chinese (4.7%, a difference of 0.21%), European (4.6%, a difference of 0.35%), and Carpatho Rusyn (4.7%, a difference of 0.59%).
| Demographics | Rating | Rank | Unemployment |
| Pennsylvania Germans | 100.0 /100 | #12 | Exceptional 4.6% |
| Belgians | 100.0 /100 | #13 | Exceptional 4.6% |
| Immigrants | Cuba | 100.0 /100 | #14 | Exceptional 4.6% |
| Europeans | 99.9 /100 | #15 | Exceptional 4.6% |
| Chinese | 99.9 /100 | #16 | Exceptional 4.7% |
| Slovenes | 99.9 /100 | #17 | Exceptional 4.7% |
| Immigrants | Venezuela | 99.9 /100 | #18 | Exceptional 4.7% |
| Scottish | 99.9 /100 | #19 | Exceptional 4.7% |
| Carpatho Rusyns | 99.9 /100 | #20 | Exceptional 4.7% |
| Welsh | 99.9 /100 | #21 | Exceptional 4.7% |
| Thais | 99.9 /100 | #22 | Exceptional 4.7% |
| British | 99.9 /100 | #23 | Exceptional 4.7% |
| Venezuelans | 99.9 /100 | #24 | Exceptional 4.7% |
| Latvians | 99.9 /100 | #25 | Exceptional 4.7% |
| Bulgarians | 99.9 /100 | #26 | Exceptional 4.7% |
Demographics Similar to Alaskan Athabascans by Unemployment
In terms of unemployment, the demographic groups most similar to Alaskan Athabascans are Immigrants from Yemen (7.7%, a difference of 0.72%), Apache (7.4%, a difference of 3.0%), Immigrants from Dominican Republic (7.4%, a difference of 3.5%), Sioux (7.4%, a difference of 3.6%), and Dominican (7.4%, a difference of 4.0%).
| Demographics | Rating | Rank | Unemployment |
| Tsimshian | 0.0 /100 | #328 | Tragic 7.2% |
| Alaska Natives | 0.0 /100 | #329 | Tragic 7.2% |
| Yakama | 0.0 /100 | #330 | Tragic 7.3% |
| Dominicans | 0.0 /100 | #331 | Tragic 7.4% |
| Sioux | 0.0 /100 | #332 | Tragic 7.4% |
| Immigrants | Dominican Republic | 0.0 /100 | #333 | Tragic 7.4% |
| Apache | 0.0 /100 | #334 | Tragic 7.4% |
| Alaskan Athabascans | 0.0 /100 | #335 | Tragic 7.7% |
| Immigrants | Yemen | 0.0 /100 | #336 | Tragic 7.7% |
| Cheyenne | 0.0 /100 | #337 | Tragic 8.0% |
| Pima | 0.0 /100 | #338 | Tragic 8.2% |
| Navajo | 0.0 /100 | #339 | Tragic 8.4% |
| Puerto Ricans | 0.0 /100 | #340 | Tragic 8.4% |
| Tohono O'odham | 0.0 /100 | #341 | Tragic 8.9% |
| Hopi | 0.0 /100 | #342 | Tragic 8.9% |