Immigrants from Morocco vs Alaskan Athabascan Family Poverty
COMPARE
Immigrants from Morocco
Alaskan Athabascan
Family Poverty
Family Poverty Comparison
Immigrants from Morocco
Alaskan Athabascans
9.1%
FAMILY POVERTY
40.2/ 100
METRIC RATING
182nd/ 347
METRIC RANK
10.1%
FAMILY POVERTY
2.7/ 100
METRIC RATING
231st/ 347
METRIC RANK
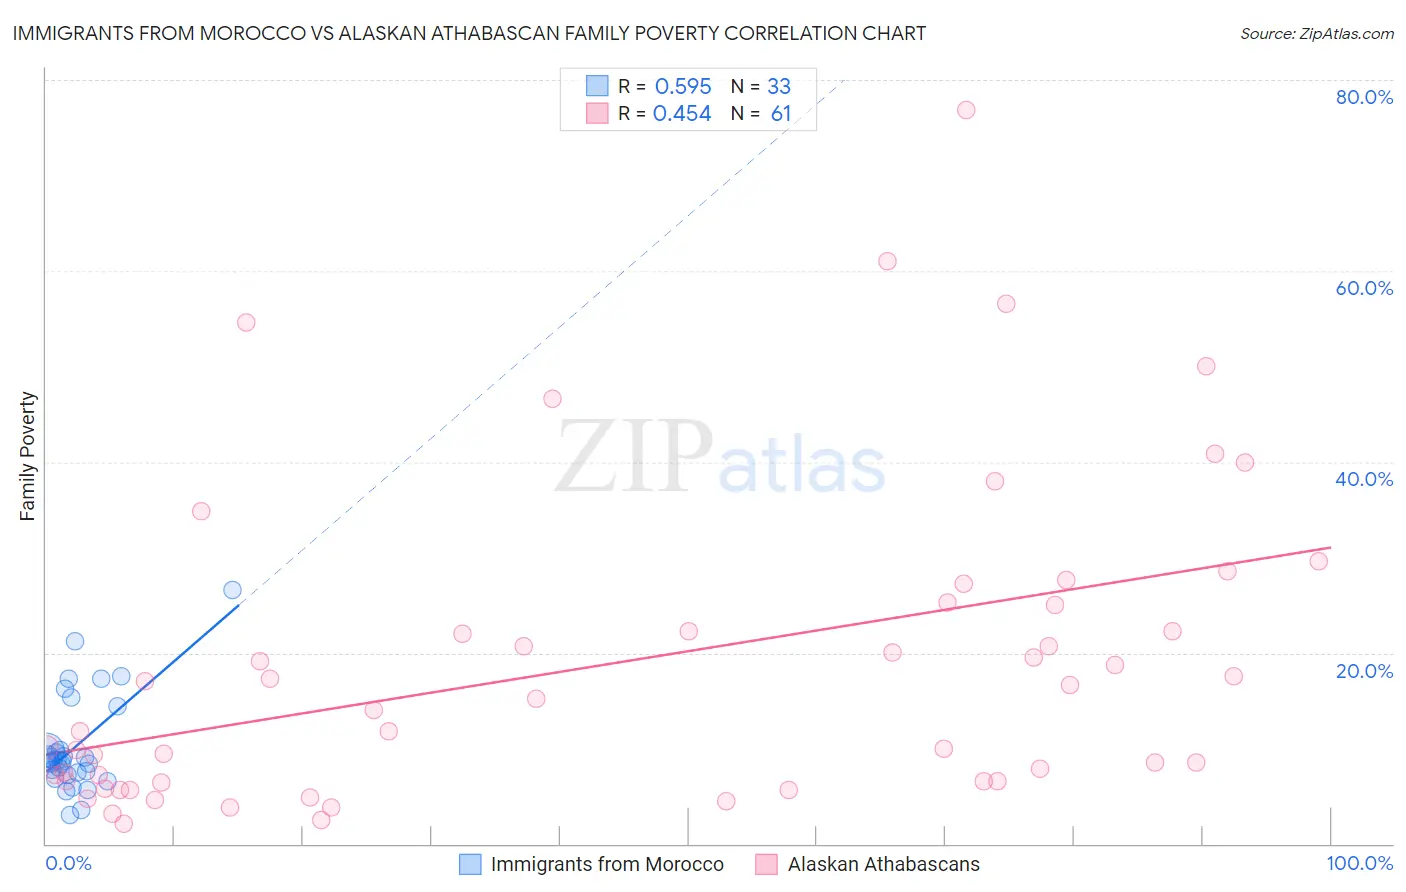
Immigrants from Morocco vs Alaskan Athabascan Family Poverty Correlation Chart
The statistical analysis conducted on geographies consisting of 178,782,527 people shows a substantial positive correlation between the proportion of Immigrants from Morocco and poverty level among families in the United States with a correlation coefficient (R) of 0.595 and weighted average of 9.1%. Similarly, the statistical analysis conducted on geographies consisting of 45,790,128 people shows a moderate positive correlation between the proportion of Alaskan Athabascans and poverty level among families in the United States with a correlation coefficient (R) of 0.454 and weighted average of 10.1%, a difference of 10.3%.
Family Poverty Correlation Summary
| Measurement | Immigrants from Morocco | Alaskan Athabascan |
| Minimum | 3.0% | 2.0% |
| Maximum | 26.5% | 76.9% |
| Range | 23.5% | 74.9% |
| Mean | 10.2% | 18.8% |
| Median | 8.7% | 14.0% |
| Interquartile 25% (IQ1) | 7.3% | 6.5% |
| Interquartile 75% (IQ3) | 12.1% | 25.1% |
| Interquartile Range (IQR) | 4.8% | 18.6% |
| Standard Deviation (Sample) | 5.2% | 16.5% |
| Standard Deviation (Population) | 5.1% | 16.3% |
Similar Demographics by Family Poverty
Demographics Similar to Immigrants from Morocco by Family Poverty
In terms of family poverty, the demographic groups most similar to Immigrants from Morocco are Hmong (9.1%, a difference of 0.010%), Uruguayan (9.1%, a difference of 0.13%), South American Indian (9.1%, a difference of 0.20%), Immigrants from Saudi Arabia (9.1%, a difference of 0.21%), and Immigrants from Uganda (9.1%, a difference of 0.43%).
| Demographics | Rating | Rank | Family Poverty |
| Costa Ricans | 49.3 /100 | #175 | Average 9.0% |
| Immigrants | Syria | 47.5 /100 | #176 | Average 9.0% |
| Hawaiians | 47.2 /100 | #177 | Average 9.0% |
| Immigrants | Cameroon | 47.1 /100 | #178 | Average 9.0% |
| Immigrants | Iraq | 44.4 /100 | #179 | Average 9.1% |
| Immigrants | Uganda | 43.4 /100 | #180 | Average 9.1% |
| Hmong | 40.2 /100 | #181 | Average 9.1% |
| Immigrants | Morocco | 40.2 /100 | #182 | Average 9.1% |
| Uruguayans | 39.2 /100 | #183 | Fair 9.1% |
| South American Indians | 38.7 /100 | #184 | Fair 9.1% |
| Immigrants | Saudi Arabia | 38.6 /100 | #185 | Fair 9.1% |
| Colombians | 36.1 /100 | #186 | Fair 9.2% |
| Delaware | 35.4 /100 | #187 | Fair 9.2% |
| Immigrants | Kenya | 34.0 /100 | #188 | Fair 9.2% |
| Immigrants | Afghanistan | 32.1 /100 | #189 | Fair 9.2% |
Demographics Similar to Alaskan Athabascans by Family Poverty
In terms of family poverty, the demographic groups most similar to Alaskan Athabascans are Immigrants from Panama (10.0%, a difference of 0.38%), Immigrants from Uzbekistan (10.0%, a difference of 0.40%), Sudanese (10.0%, a difference of 0.41%), Immigrants from Sudan (10.1%, a difference of 0.43%), and Immigrants from Armenia (10.0%, a difference of 0.62%).
| Demographics | Rating | Rank | Family Poverty |
| Marshallese | 3.9 /100 | #224 | Tragic 9.9% |
| Immigrants | Immigrants | 3.6 /100 | #225 | Tragic 10.0% |
| Ottawa | 3.3 /100 | #226 | Tragic 10.0% |
| Immigrants | Armenia | 3.3 /100 | #227 | Tragic 10.0% |
| Sudanese | 3.1 /100 | #228 | Tragic 10.0% |
| Immigrants | Uzbekistan | 3.1 /100 | #229 | Tragic 10.0% |
| Immigrants | Panama | 3.1 /100 | #230 | Tragic 10.0% |
| Alaskan Athabascans | 2.7 /100 | #231 | Tragic 10.1% |
| Immigrants | Sudan | 2.3 /100 | #232 | Tragic 10.1% |
| Fijians | 2.1 /100 | #233 | Tragic 10.1% |
| Immigrants | Middle Africa | 2.1 /100 | #234 | Tragic 10.1% |
| Nigerians | 2.0 /100 | #235 | Tragic 10.1% |
| Immigrants | Nigeria | 1.9 /100 | #236 | Tragic 10.2% |
| Immigrants | Laos | 1.7 /100 | #237 | Tragic 10.2% |
| French American Indians | 1.5 /100 | #238 | Tragic 10.2% |