Immigrants from Morocco vs Immigrants from Caribbean Unemployment
COMPARE
Immigrants from Morocco
Immigrants from Caribbean
Unemployment
Unemployment Comparison
Immigrants from Morocco
Immigrants from Caribbean
5.2%
UNEMPLOYMENT
59.1/ 100
METRIC RATING
169th/ 347
METRIC RANK
6.2%
UNEMPLOYMENT
0.0/ 100
METRIC RATING
286th/ 347
METRIC RANK
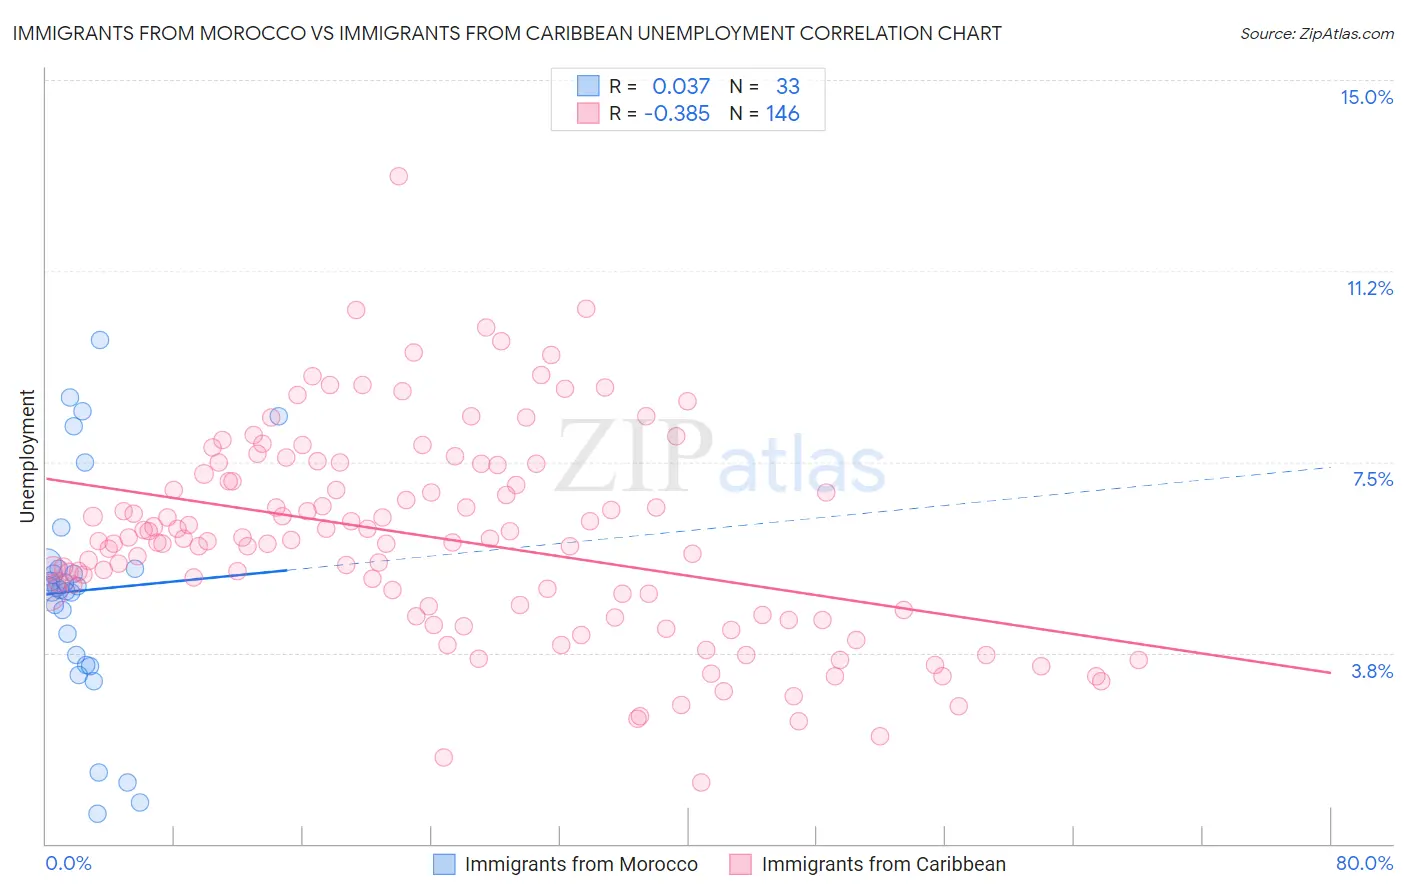
Immigrants from Morocco vs Immigrants from Caribbean Unemployment Correlation Chart
The statistical analysis conducted on geographies consisting of 178,898,527 people shows no correlation between the proportion of Immigrants from Morocco and unemployment in the United States with a correlation coefficient (R) of 0.037 and weighted average of 5.2%. Similarly, the statistical analysis conducted on geographies consisting of 449,366,632 people shows a mild negative correlation between the proportion of Immigrants from Caribbean and unemployment in the United States with a correlation coefficient (R) of -0.385 and weighted average of 6.2%, a difference of 17.7%.
Unemployment Correlation Summary
| Measurement | Immigrants from Morocco | Immigrants from Caribbean |
| Minimum | 0.60% | 1.2% |
| Maximum | 9.9% | 13.1% |
| Range | 9.3% | 11.9% |
| Mean | 5.0% | 6.0% |
| Median | 5.0% | 6.0% |
| Interquartile 25% (IQ1) | 3.6% | 4.6% |
| Interquartile 75% (IQ3) | 5.4% | 7.3% |
| Interquartile Range (IQR) | 1.8% | 2.7% |
| Standard Deviation (Sample) | 2.2% | 2.0% |
| Standard Deviation (Population) | 2.2% | 2.0% |
Similar Demographics by Unemployment
Demographics Similar to Immigrants from Morocco by Unemployment
In terms of unemployment, the demographic groups most similar to Immigrants from Morocco are Uruguayan (5.2%, a difference of 0.070%), Immigrants from Nicaragua (5.2%, a difference of 0.12%), Colombian (5.2%, a difference of 0.13%), Immigrants from Indonesia (5.2%, a difference of 0.14%), and Puget Sound Salish (5.2%, a difference of 0.16%).
| Demographics | Rating | Rank | Unemployment |
| Spanish | 65.1 /100 | #162 | Good 5.2% |
| Immigrants | Zaire | 64.7 /100 | #163 | Good 5.2% |
| Immigrants | Colombia | 64.7 /100 | #164 | Good 5.2% |
| Immigrants | Brazil | 63.1 /100 | #165 | Good 5.2% |
| Immigrants | Indonesia | 61.2 /100 | #166 | Good 5.2% |
| Colombians | 61.1 /100 | #167 | Good 5.2% |
| Uruguayans | 60.2 /100 | #168 | Good 5.2% |
| Immigrants | Morocco | 59.1 /100 | #169 | Average 5.2% |
| Immigrants | Nicaragua | 57.1 /100 | #170 | Average 5.2% |
| Puget Sound Salish | 56.6 /100 | #171 | Average 5.2% |
| Immigrants | Vietnam | 52.5 /100 | #172 | Average 5.2% |
| Immigrants | Poland | 51.8 /100 | #173 | Average 5.3% |
| Immigrants | Congo | 50.0 /100 | #174 | Average 5.3% |
| Taiwanese | 49.6 /100 | #175 | Average 5.3% |
| Nicaraguans | 48.7 /100 | #176 | Average 5.3% |
Demographics Similar to Immigrants from Caribbean by Unemployment
In terms of unemployment, the demographic groups most similar to Immigrants from Caribbean are Nepalese (6.2%, a difference of 0.33%), Ecuadorian (6.2%, a difference of 0.36%), Immigrants from Senegal (6.1%, a difference of 0.43%), Chippewa (6.2%, a difference of 0.71%), and Senegalese (6.2%, a difference of 0.80%).
| Demographics | Rating | Rank | Unemployment |
| Immigrants | Mexico | 0.0 /100 | #279 | Tragic 6.0% |
| Immigrants | Western Africa | 0.0 /100 | #280 | Tragic 6.0% |
| Africans | 0.0 /100 | #281 | Tragic 6.1% |
| Immigrants | Azores | 0.0 /100 | #282 | Tragic 6.1% |
| Immigrants | Ghana | 0.0 /100 | #283 | Tragic 6.1% |
| Aleuts | 0.0 /100 | #284 | Tragic 6.1% |
| Immigrants | Senegal | 0.0 /100 | #285 | Tragic 6.1% |
| Immigrants | Caribbean | 0.0 /100 | #286 | Tragic 6.2% |
| Nepalese | 0.0 /100 | #287 | Tragic 6.2% |
| Ecuadorians | 0.0 /100 | #288 | Tragic 6.2% |
| Chippewa | 0.0 /100 | #289 | Tragic 6.2% |
| Senegalese | 0.0 /100 | #290 | Tragic 6.2% |
| Haitians | 0.0 /100 | #291 | Tragic 6.2% |
| Central American Indians | 0.0 /100 | #292 | Tragic 6.2% |
| Immigrants | Ecuador | 0.0 /100 | #293 | Tragic 6.2% |