Immigrants from Morocco vs Egyptian Unemployment
COMPARE
Immigrants from Morocco
Egyptian
Unemployment
Unemployment Comparison
Immigrants from Morocco
Egyptians
5.2%
UNEMPLOYMENT
59.1/ 100
METRIC RATING
169th/ 347
METRIC RANK
5.2%
UNEMPLOYMENT
75.2/ 100
METRIC RATING
153rd/ 347
METRIC RANK
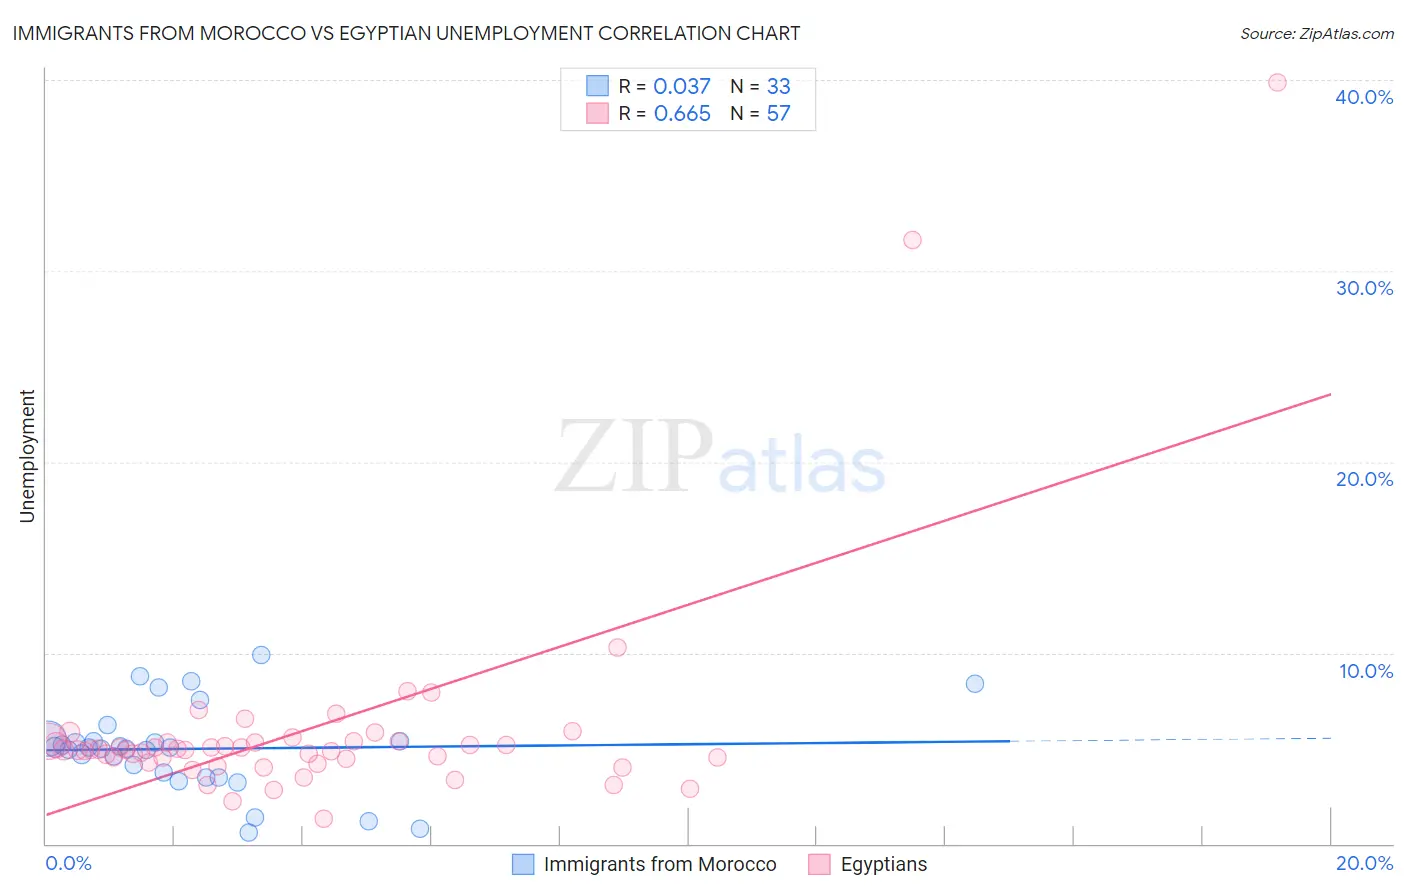
Immigrants from Morocco vs Egyptian Unemployment Correlation Chart
The statistical analysis conducted on geographies consisting of 178,898,527 people shows no correlation between the proportion of Immigrants from Morocco and unemployment in the United States with a correlation coefficient (R) of 0.037 and weighted average of 5.2%. Similarly, the statistical analysis conducted on geographies consisting of 276,825,102 people shows a significant positive correlation between the proportion of Egyptians and unemployment in the United States with a correlation coefficient (R) of 0.665 and weighted average of 5.2%, a difference of 1.2%.
Unemployment Correlation Summary
| Measurement | Immigrants from Morocco | Egyptian |
| Minimum | 0.60% | 1.3% |
| Maximum | 9.9% | 39.9% |
| Range | 9.3% | 38.6% |
| Mean | 5.0% | 6.0% |
| Median | 5.0% | 4.9% |
| Interquartile 25% (IQ1) | 3.6% | 4.4% |
| Interquartile 75% (IQ3) | 5.4% | 5.4% |
| Interquartile Range (IQR) | 1.8% | 1.0% |
| Standard Deviation (Sample) | 2.2% | 5.9% |
| Standard Deviation (Population) | 2.2% | 5.9% |
Demographics Similar to Immigrants from Morocco and Egyptians by Unemployment
In terms of unemployment, the demographic groups most similar to Immigrants from Morocco are Uruguayan (5.2%, a difference of 0.070%), Immigrants from Nicaragua (5.2%, a difference of 0.12%), Colombian (5.2%, a difference of 0.13%), Immigrants from Indonesia (5.2%, a difference of 0.14%), and Puget Sound Salish (5.2%, a difference of 0.16%). Similarly, the demographic groups most similar to Egyptians are Immigrants from Hong Kong (5.2%, a difference of 0.0%), Immigrants from Eastern Europe (5.2%, a difference of 0.010%), Immigrants from China (5.2%, a difference of 0.040%), Immigrants from Northern Africa (5.2%, a difference of 0.32%), and Immigrants from Kazakhstan (5.2%, a difference of 0.38%).
| Demographics | Rating | Rank | Unemployment |
| Immigrants | Eastern Europe | 75.3 /100 | #151 | Good 5.2% |
| Immigrants | Hong Kong | 75.2 /100 | #152 | Good 5.2% |
| Egyptians | 75.2 /100 | #153 | Good 5.2% |
| Immigrants | China | 74.7 /100 | #154 | Good 5.2% |
| Immigrants | Northern Africa | 71.3 /100 | #155 | Good 5.2% |
| Immigrants | Kazakhstan | 70.4 /100 | #156 | Good 5.2% |
| Sri Lankans | 69.5 /100 | #157 | Good 5.2% |
| Immigrants | Egypt | 66.7 /100 | #158 | Good 5.2% |
| Immigrants | Russia | 66.6 /100 | #159 | Good 5.2% |
| Laotians | 66.3 /100 | #160 | Good 5.2% |
| Immigrants | Oceania | 65.2 /100 | #161 | Good 5.2% |
| Spanish | 65.1 /100 | #162 | Good 5.2% |
| Immigrants | Zaire | 64.7 /100 | #163 | Good 5.2% |
| Immigrants | Colombia | 64.7 /100 | #164 | Good 5.2% |
| Immigrants | Brazil | 63.1 /100 | #165 | Good 5.2% |
| Immigrants | Indonesia | 61.2 /100 | #166 | Good 5.2% |
| Colombians | 61.1 /100 | #167 | Good 5.2% |
| Uruguayans | 60.2 /100 | #168 | Good 5.2% |
| Immigrants | Morocco | 59.1 /100 | #169 | Average 5.2% |
| Immigrants | Nicaragua | 57.1 /100 | #170 | Average 5.2% |
| Puget Sound Salish | 56.6 /100 | #171 | Average 5.2% |