Immigrants from Morocco vs Laotian Unemployment
COMPARE
Immigrants from Morocco
Laotian
Unemployment
Unemployment Comparison
Immigrants from Morocco
Laotians
5.2%
UNEMPLOYMENT
59.1/ 100
METRIC RATING
169th/ 347
METRIC RANK
5.2%
UNEMPLOYMENT
66.3/ 100
METRIC RATING
160th/ 347
METRIC RANK
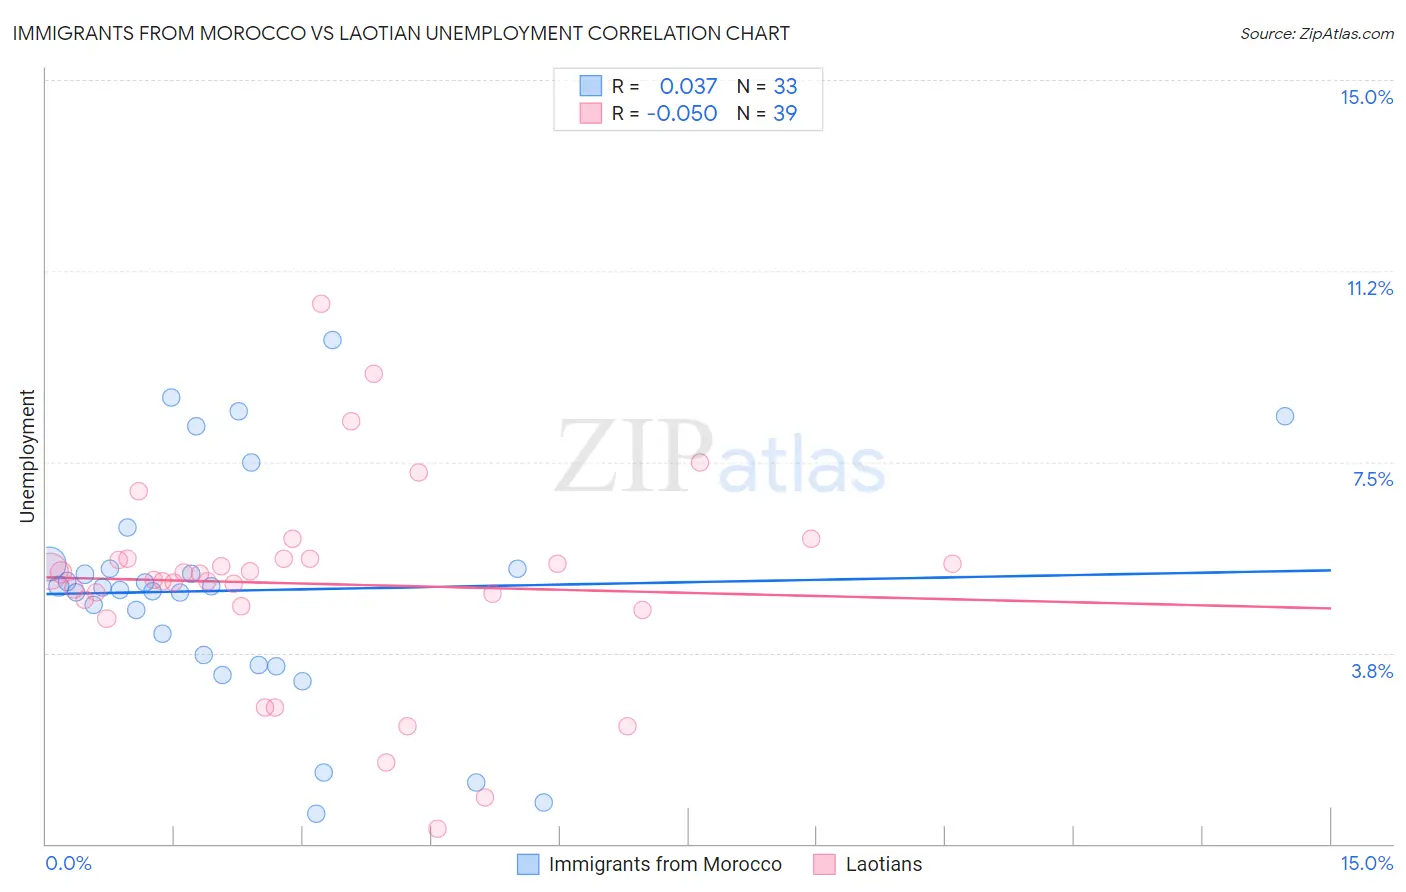
Immigrants from Morocco vs Laotian Unemployment Correlation Chart
The statistical analysis conducted on geographies consisting of 178,898,527 people shows no correlation between the proportion of Immigrants from Morocco and unemployment in the United States with a correlation coefficient (R) of 0.037 and weighted average of 5.2%. Similarly, the statistical analysis conducted on geographies consisting of 224,771,709 people shows a slight negative correlation between the proportion of Laotians and unemployment in the United States with a correlation coefficient (R) of -0.050 and weighted average of 5.2%, a difference of 0.48%.
Unemployment Correlation Summary
| Measurement | Immigrants from Morocco | Laotian |
| Minimum | 0.60% | 0.30% |
| Maximum | 9.9% | 10.6% |
| Range | 9.3% | 10.3% |
| Mean | 5.0% | 5.1% |
| Median | 5.0% | 5.3% |
| Interquartile 25% (IQ1) | 3.6% | 4.7% |
| Interquartile 75% (IQ3) | 5.4% | 5.6% |
| Interquartile Range (IQR) | 1.8% | 0.94% |
| Standard Deviation (Sample) | 2.2% | 2.0% |
| Standard Deviation (Population) | 2.2% | 2.0% |
Demographics Similar to Immigrants from Morocco and Laotians by Unemployment
In terms of unemployment, the demographic groups most similar to Immigrants from Morocco are Uruguayan (5.2%, a difference of 0.070%), Immigrants from Nicaragua (5.2%, a difference of 0.12%), Colombian (5.2%, a difference of 0.13%), Immigrants from Indonesia (5.2%, a difference of 0.14%), and Puget Sound Salish (5.2%, a difference of 0.16%). Similarly, the demographic groups most similar to Laotians are Immigrants from Egypt (5.2%, a difference of 0.020%), Immigrants from Russia (5.2%, a difference of 0.020%), Immigrants from Oceania (5.2%, a difference of 0.080%), Spanish (5.2%, a difference of 0.090%), and Immigrants from Zaire (5.2%, a difference of 0.11%).
| Demographics | Rating | Rank | Unemployment |
| Immigrants | China | 74.7 /100 | #154 | Good 5.2% |
| Immigrants | Northern Africa | 71.3 /100 | #155 | Good 5.2% |
| Immigrants | Kazakhstan | 70.4 /100 | #156 | Good 5.2% |
| Sri Lankans | 69.5 /100 | #157 | Good 5.2% |
| Immigrants | Egypt | 66.7 /100 | #158 | Good 5.2% |
| Immigrants | Russia | 66.6 /100 | #159 | Good 5.2% |
| Laotians | 66.3 /100 | #160 | Good 5.2% |
| Immigrants | Oceania | 65.2 /100 | #161 | Good 5.2% |
| Spanish | 65.1 /100 | #162 | Good 5.2% |
| Immigrants | Zaire | 64.7 /100 | #163 | Good 5.2% |
| Immigrants | Colombia | 64.7 /100 | #164 | Good 5.2% |
| Immigrants | Brazil | 63.1 /100 | #165 | Good 5.2% |
| Immigrants | Indonesia | 61.2 /100 | #166 | Good 5.2% |
| Colombians | 61.1 /100 | #167 | Good 5.2% |
| Uruguayans | 60.2 /100 | #168 | Good 5.2% |
| Immigrants | Morocco | 59.1 /100 | #169 | Average 5.2% |
| Immigrants | Nicaragua | 57.1 /100 | #170 | Average 5.2% |
| Puget Sound Salish | 56.6 /100 | #171 | Average 5.2% |
| Immigrants | Vietnam | 52.5 /100 | #172 | Average 5.2% |
| Immigrants | Poland | 51.8 /100 | #173 | Average 5.3% |
| Immigrants | Congo | 50.0 /100 | #174 | Average 5.3% |