Immigrants from Morocco vs Cambodian Unemployment
COMPARE
Immigrants from Morocco
Cambodian
Unemployment
Unemployment Comparison
Immigrants from Morocco
Cambodians
5.2%
UNEMPLOYMENT
59.1/ 100
METRIC RATING
169th/ 347
METRIC RANK
4.9%
UNEMPLOYMENT
99.0/ 100
METRIC RATING
61st/ 347
METRIC RANK
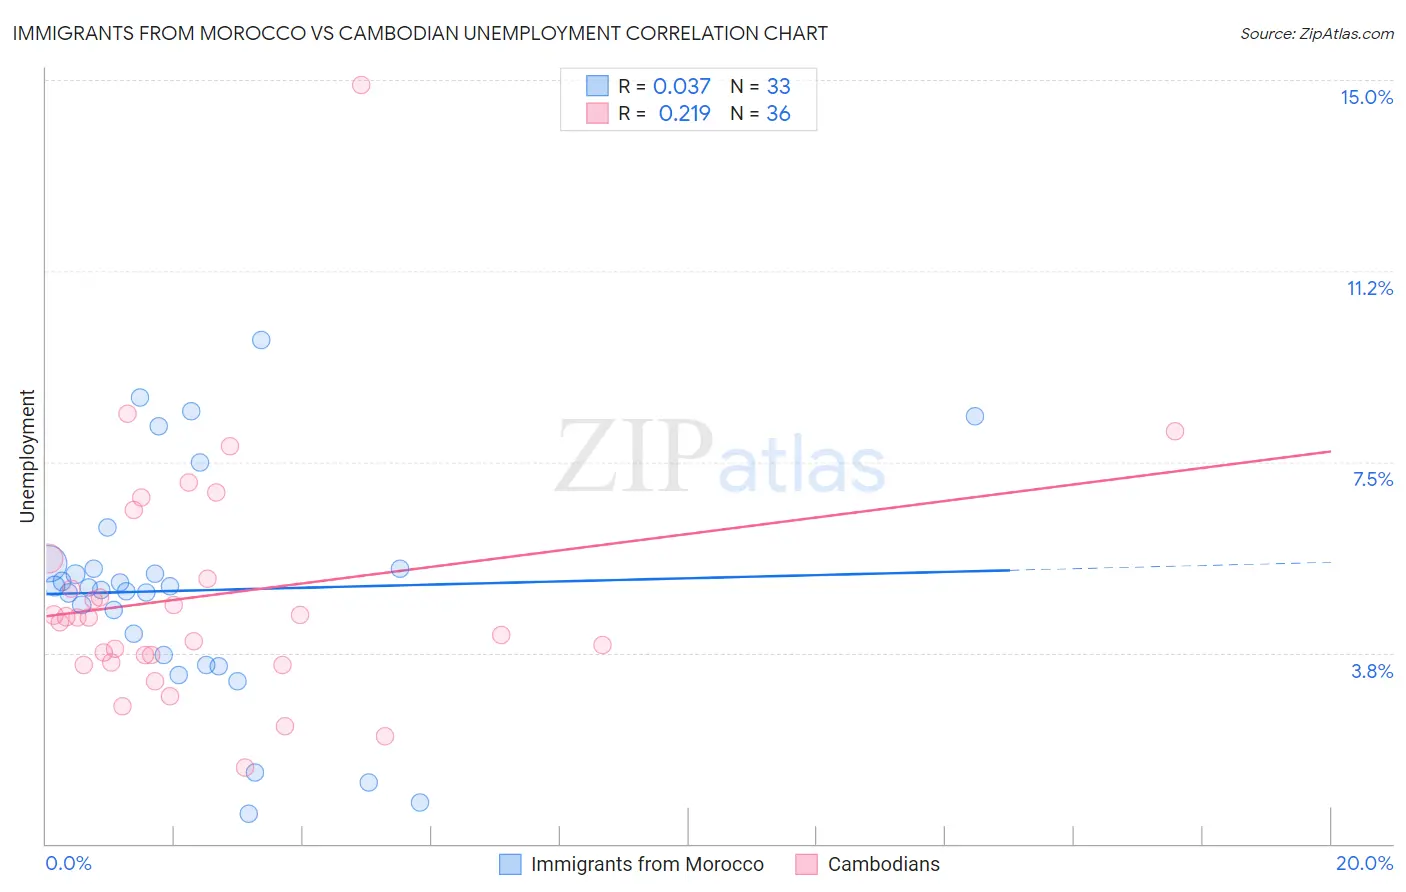
Immigrants from Morocco vs Cambodian Unemployment Correlation Chart
The statistical analysis conducted on geographies consisting of 178,898,527 people shows no correlation between the proportion of Immigrants from Morocco and unemployment in the United States with a correlation coefficient (R) of 0.037 and weighted average of 5.2%. Similarly, the statistical analysis conducted on geographies consisting of 102,491,878 people shows a weak positive correlation between the proportion of Cambodians and unemployment in the United States with a correlation coefficient (R) of 0.219 and weighted average of 4.9%, a difference of 6.9%.
Unemployment Correlation Summary
| Measurement | Immigrants from Morocco | Cambodian |
| Minimum | 0.60% | 1.5% |
| Maximum | 9.9% | 14.9% |
| Range | 9.3% | 13.4% |
| Mean | 5.0% | 4.9% |
| Median | 5.0% | 4.4% |
| Interquartile 25% (IQ1) | 3.6% | 3.6% |
| Interquartile 75% (IQ3) | 5.4% | 5.4% |
| Interquartile Range (IQR) | 1.8% | 1.8% |
| Standard Deviation (Sample) | 2.2% | 2.4% |
| Standard Deviation (Population) | 2.2% | 2.4% |
Similar Demographics by Unemployment
Demographics Similar to Immigrants from Morocco by Unemployment
In terms of unemployment, the demographic groups most similar to Immigrants from Morocco are Uruguayan (5.2%, a difference of 0.070%), Immigrants from Nicaragua (5.2%, a difference of 0.12%), Colombian (5.2%, a difference of 0.13%), Immigrants from Indonesia (5.2%, a difference of 0.14%), and Puget Sound Salish (5.2%, a difference of 0.16%).
| Demographics | Rating | Rank | Unemployment |
| Spanish | 65.1 /100 | #162 | Good 5.2% |
| Immigrants | Zaire | 64.7 /100 | #163 | Good 5.2% |
| Immigrants | Colombia | 64.7 /100 | #164 | Good 5.2% |
| Immigrants | Brazil | 63.1 /100 | #165 | Good 5.2% |
| Immigrants | Indonesia | 61.2 /100 | #166 | Good 5.2% |
| Colombians | 61.1 /100 | #167 | Good 5.2% |
| Uruguayans | 60.2 /100 | #168 | Good 5.2% |
| Immigrants | Morocco | 59.1 /100 | #169 | Average 5.2% |
| Immigrants | Nicaragua | 57.1 /100 | #170 | Average 5.2% |
| Puget Sound Salish | 56.6 /100 | #171 | Average 5.2% |
| Immigrants | Vietnam | 52.5 /100 | #172 | Average 5.2% |
| Immigrants | Poland | 51.8 /100 | #173 | Average 5.3% |
| Immigrants | Congo | 50.0 /100 | #174 | Average 5.3% |
| Taiwanese | 49.6 /100 | #175 | Average 5.3% |
| Nicaraguans | 48.7 /100 | #176 | Average 5.3% |
Demographics Similar to Cambodians by Unemployment
In terms of unemployment, the demographic groups most similar to Cambodians are Immigrants from Netherlands (4.9%, a difference of 0.0%), Icelander (4.9%, a difference of 0.010%), Immigrants from Bulgaria (4.9%, a difference of 0.030%), Bhutanese (4.9%, a difference of 0.050%), and Greek (4.9%, a difference of 0.070%).
| Demographics | Rating | Rank | Unemployment |
| Eastern Europeans | 99.2 /100 | #54 | Exceptional 4.9% |
| Australians | 99.2 /100 | #55 | Exceptional 4.9% |
| Celtics | 99.1 /100 | #56 | Exceptional 4.9% |
| Immigrants | Singapore | 99.1 /100 | #57 | Exceptional 4.9% |
| Greeks | 99.0 /100 | #58 | Exceptional 4.9% |
| Bhutanese | 99.0 /100 | #59 | Exceptional 4.9% |
| Immigrants | Netherlands | 99.0 /100 | #60 | Exceptional 4.9% |
| Cambodians | 99.0 /100 | #61 | Exceptional 4.9% |
| Icelanders | 98.9 /100 | #62 | Exceptional 4.9% |
| Immigrants | Bulgaria | 98.9 /100 | #63 | Exceptional 4.9% |
| Italians | 98.9 /100 | #64 | Exceptional 4.9% |
| Immigrants | Canada | 98.8 /100 | #65 | Exceptional 4.9% |
| Slovaks | 98.7 /100 | #66 | Exceptional 4.9% |
| New Zealanders | 98.6 /100 | #67 | Exceptional 4.9% |
| Slavs | 98.6 /100 | #68 | Exceptional 4.9% |