Immigrants from Malaysia vs Scottish Unemployment Among Women with Children Ages 6 to 17 years
COMPARE
Immigrants from Malaysia
Scottish
Unemployment Among Women with Children Ages 6 to 17 years
Unemployment Among Women with Children Ages 6 to 17 years Comparison
Immigrants from Malaysia
Scottish
8.2%
UNEMPLOYMENT AMONG WOMEN WITH CHILDREN AGES 6 TO 17 YEARS
100.0/ 100
METRIC RATING
58th/ 347
METRIC RANK
9.4%
UNEMPLOYMENT AMONG WOMEN WITH CHILDREN AGES 6 TO 17 YEARS
2.0/ 100
METRIC RATING
243rd/ 347
METRIC RANK
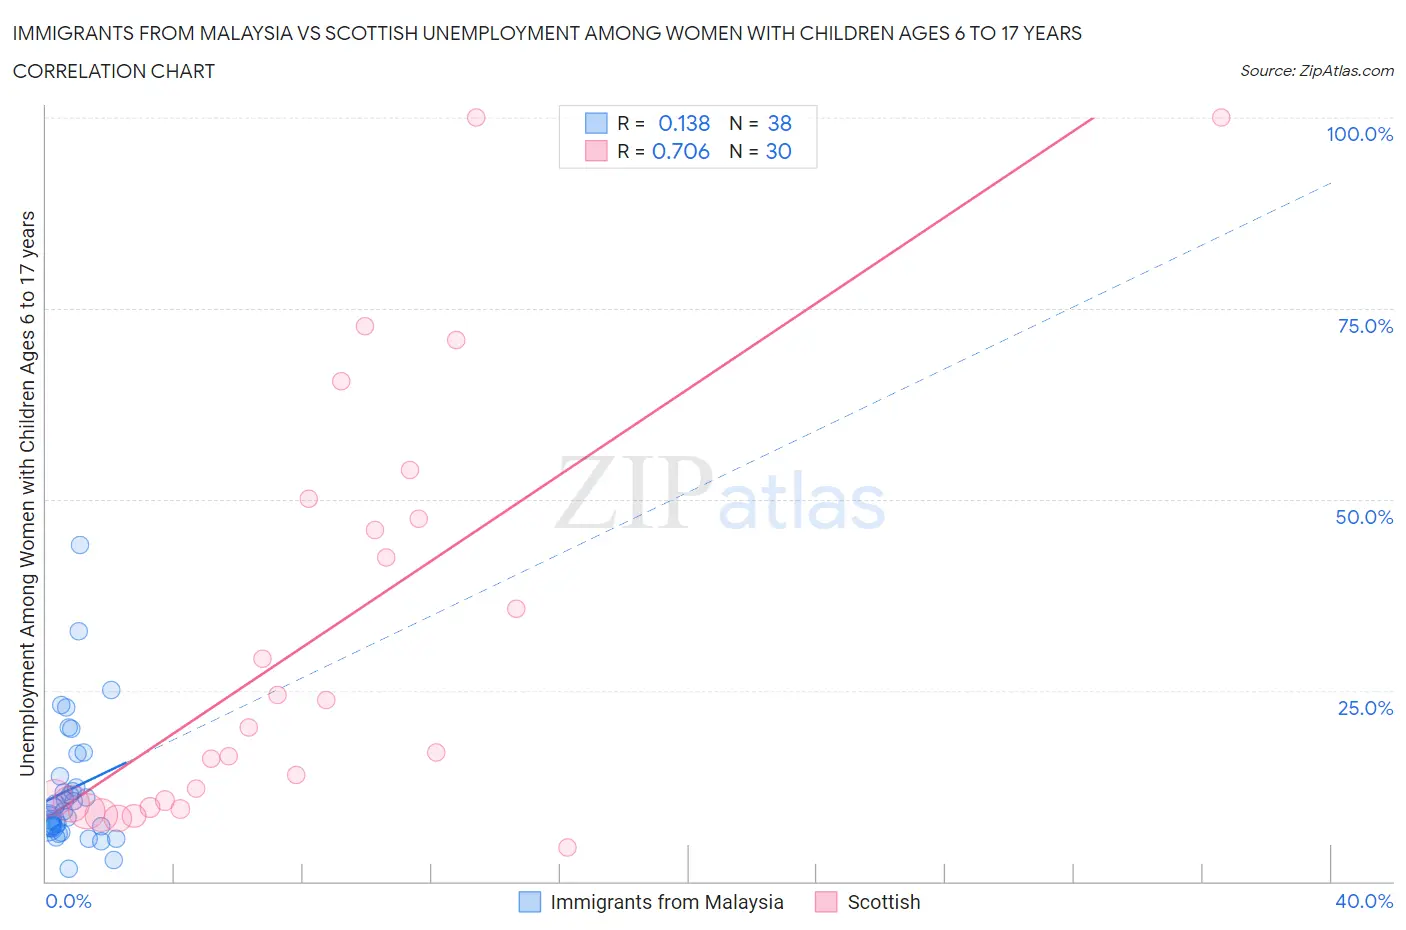
Immigrants from Malaysia vs Scottish Unemployment Among Women with Children Ages 6 to 17 years Correlation Chart
The statistical analysis conducted on geographies consisting of 160,783,696 people shows a poor positive correlation between the proportion of Immigrants from Malaysia and unemployment rate among women with children between the ages 6 and 17 in the United States with a correlation coefficient (R) of 0.138 and weighted average of 8.2%. Similarly, the statistical analysis conducted on geographies consisting of 354,178,557 people shows a strong positive correlation between the proportion of Scottish and unemployment rate among women with children between the ages 6 and 17 in the United States with a correlation coefficient (R) of 0.706 and weighted average of 9.4%, a difference of 14.4%.
Unemployment Among Women with Children Ages 6 to 17 years Correlation Summary
| Measurement | Immigrants from Malaysia | Scottish |
| Minimum | 1.6% | 4.5% |
| Maximum | 44.0% | 100.0% |
| Range | 42.4% | 95.5% |
| Mean | 12.0% | 31.6% |
| Median | 9.4% | 18.5% |
| Interquartile 25% (IQ1) | 7.2% | 10.1% |
| Interquartile 75% (IQ3) | 13.8% | 47.4% |
| Interquartile Range (IQR) | 6.6% | 37.3% |
| Standard Deviation (Sample) | 8.5% | 27.5% |
| Standard Deviation (Population) | 8.4% | 27.0% |
Similar Demographics by Unemployment Among Women with Children Ages 6 to 17 years
Demographics Similar to Immigrants from Malaysia by Unemployment Among Women with Children Ages 6 to 17 years
In terms of unemployment among women with children ages 6 to 17 years, the demographic groups most similar to Immigrants from Malaysia are Immigrants from Philippines (8.2%, a difference of 0.060%), Basque (8.2%, a difference of 0.070%), Immigrants from Laos (8.2%, a difference of 0.19%), Immigrants from Bosnia and Herzegovina (8.2%, a difference of 0.21%), and Immigrants from Japan (8.2%, a difference of 0.23%).
| Demographics | Rating | Rank | Unemployment Among Women with Children Ages 6 to 17 years |
| Immigrants | Sudan | 100.0 /100 | #51 | Exceptional 8.1% |
| Immigrants | Iraq | 100.0 /100 | #52 | Exceptional 8.1% |
| Danes | 100.0 /100 | #53 | Exceptional 8.1% |
| Immigrants | Armenia | 100.0 /100 | #54 | Exceptional 8.2% |
| Immigrants | Japan | 100.0 /100 | #55 | Exceptional 8.2% |
| Immigrants | Bosnia and Herzegovina | 100.0 /100 | #56 | Exceptional 8.2% |
| Immigrants | Laos | 100.0 /100 | #57 | Exceptional 8.2% |
| Immigrants | Malaysia | 100.0 /100 | #58 | Exceptional 8.2% |
| Immigrants | Philippines | 100.0 /100 | #59 | Exceptional 8.2% |
| Basques | 100.0 /100 | #60 | Exceptional 8.2% |
| Koreans | 100.0 /100 | #61 | Exceptional 8.2% |
| Spanish American Indians | 100.0 /100 | #62 | Exceptional 8.2% |
| Immigrants | South Eastern Asia | 99.9 /100 | #63 | Exceptional 8.2% |
| Immigrants | Kuwait | 99.9 /100 | #64 | Exceptional 8.3% |
| Immigrants | Albania | 99.9 /100 | #65 | Exceptional 8.3% |
Demographics Similar to Scottish by Unemployment Among Women with Children Ages 6 to 17 years
In terms of unemployment among women with children ages 6 to 17 years, the demographic groups most similar to Scottish are English (9.4%, a difference of 0.050%), Immigrants from Cameroon (9.4%, a difference of 0.080%), Immigrants from Colombia (9.3%, a difference of 0.090%), Colombian (9.3%, a difference of 0.11%), and Guatemalan (9.3%, a difference of 0.18%).
| Demographics | Rating | Rank | Unemployment Among Women with Children Ages 6 to 17 years |
| Hungarians | 3.0 /100 | #236 | Tragic 9.3% |
| Immigrants | Belize | 2.8 /100 | #237 | Tragic 9.3% |
| Arabs | 2.7 /100 | #238 | Tragic 9.3% |
| Immigrants | Saudi Arabia | 2.7 /100 | #239 | Tragic 9.3% |
| Guatemalans | 2.3 /100 | #240 | Tragic 9.3% |
| Colombians | 2.2 /100 | #241 | Tragic 9.3% |
| Immigrants | Colombia | 2.1 /100 | #242 | Tragic 9.3% |
| Scottish | 2.0 /100 | #243 | Tragic 9.4% |
| English | 1.9 /100 | #244 | Tragic 9.4% |
| Immigrants | Cameroon | 1.8 /100 | #245 | Tragic 9.4% |
| Immigrants | Africa | 1.6 /100 | #246 | Tragic 9.4% |
| Poles | 1.5 /100 | #247 | Tragic 9.4% |
| Dutch | 1.5 /100 | #248 | Tragic 9.4% |
| Immigrants | South America | 1.5 /100 | #249 | Tragic 9.4% |
| Immigrants | Guatemala | 1.3 /100 | #250 | Tragic 9.4% |