Immigrants from Malaysia vs Lebanese Unemployment Among Women with Children Ages 6 to 17 years
COMPARE
Immigrants from Malaysia
Lebanese
Unemployment Among Women with Children Ages 6 to 17 years
Unemployment Among Women with Children Ages 6 to 17 years Comparison
Immigrants from Malaysia
Lebanese
8.2%
UNEMPLOYMENT AMONG WOMEN WITH CHILDREN AGES 6 TO 17 YEARS
100.0/ 100
METRIC RATING
58th/ 347
METRIC RANK
9.5%
UNEMPLOYMENT AMONG WOMEN WITH CHILDREN AGES 6 TO 17 YEARS
0.5/ 100
METRIC RATING
263rd/ 347
METRIC RANK
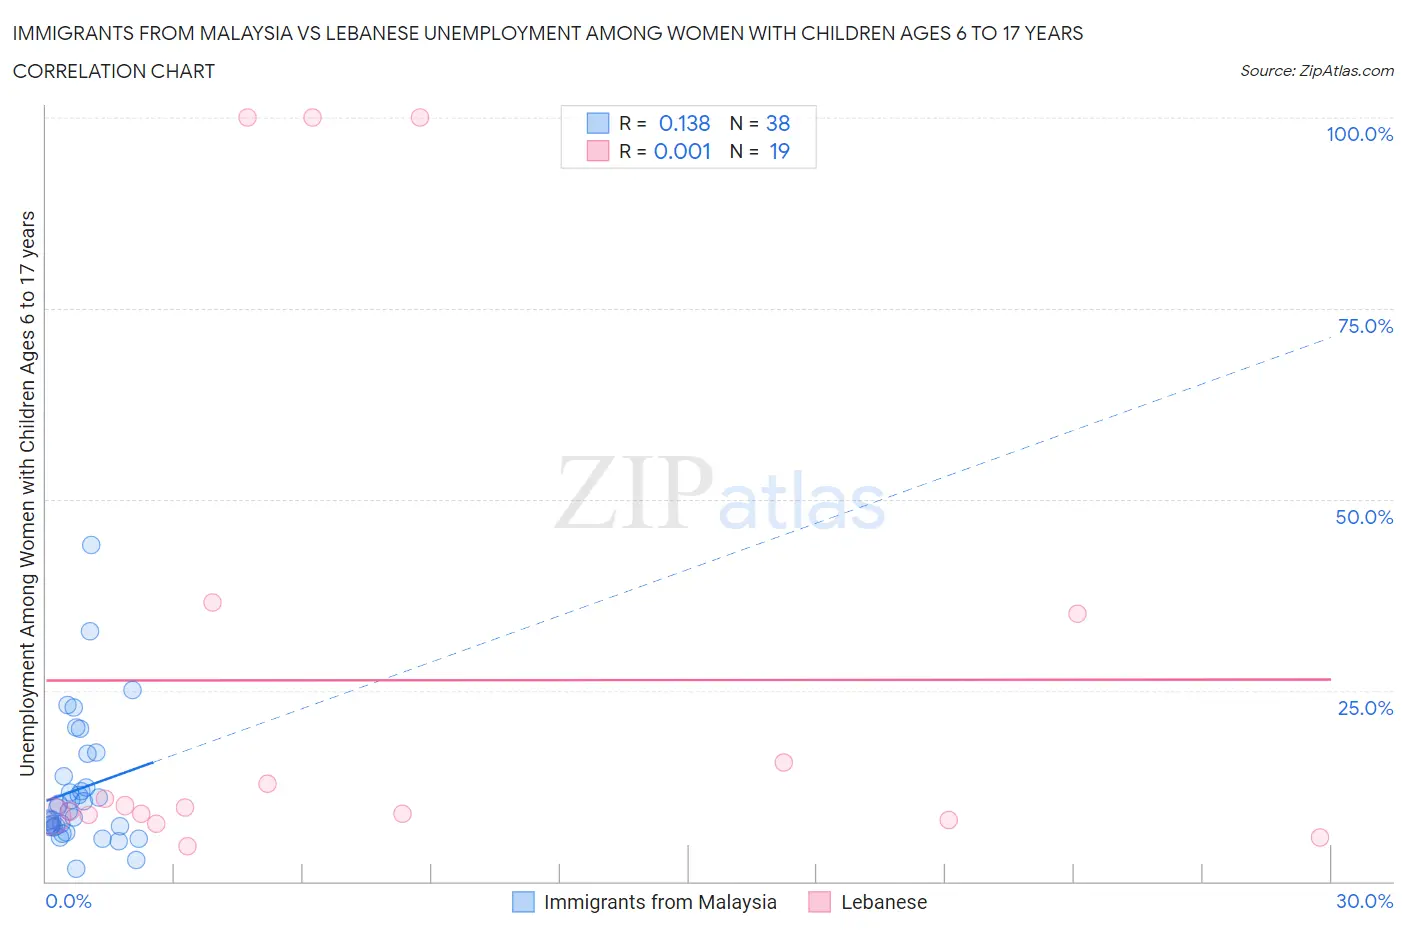
Immigrants from Malaysia vs Lebanese Unemployment Among Women with Children Ages 6 to 17 years Correlation Chart
The statistical analysis conducted on geographies consisting of 160,783,696 people shows a poor positive correlation between the proportion of Immigrants from Malaysia and unemployment rate among women with children between the ages 6 and 17 in the United States with a correlation coefficient (R) of 0.138 and weighted average of 8.2%. Similarly, the statistical analysis conducted on geographies consisting of 283,181,841 people shows no correlation between the proportion of Lebanese and unemployment rate among women with children between the ages 6 and 17 in the United States with a correlation coefficient (R) of 0.001 and weighted average of 9.5%, a difference of 16.1%.
Unemployment Among Women with Children Ages 6 to 17 years Correlation Summary
| Measurement | Immigrants from Malaysia | Lebanese |
| Minimum | 1.6% | 4.6% |
| Maximum | 44.0% | 100.0% |
| Range | 42.4% | 95.4% |
| Mean | 12.0% | 26.3% |
| Median | 9.4% | 9.6% |
| Interquartile 25% (IQ1) | 7.2% | 8.5% |
| Interquartile 75% (IQ3) | 13.8% | 35.1% |
| Interquartile Range (IQR) | 6.6% | 26.6% |
| Standard Deviation (Sample) | 8.5% | 33.9% |
| Standard Deviation (Population) | 8.4% | 33.0% |
Similar Demographics by Unemployment Among Women with Children Ages 6 to 17 years
Demographics Similar to Immigrants from Malaysia by Unemployment Among Women with Children Ages 6 to 17 years
In terms of unemployment among women with children ages 6 to 17 years, the demographic groups most similar to Immigrants from Malaysia are Immigrants from Philippines (8.2%, a difference of 0.060%), Basque (8.2%, a difference of 0.070%), Immigrants from Laos (8.2%, a difference of 0.19%), Immigrants from Bosnia and Herzegovina (8.2%, a difference of 0.21%), and Immigrants from Japan (8.2%, a difference of 0.23%).
| Demographics | Rating | Rank | Unemployment Among Women with Children Ages 6 to 17 years |
| Immigrants | Sudan | 100.0 /100 | #51 | Exceptional 8.1% |
| Immigrants | Iraq | 100.0 /100 | #52 | Exceptional 8.1% |
| Danes | 100.0 /100 | #53 | Exceptional 8.1% |
| Immigrants | Armenia | 100.0 /100 | #54 | Exceptional 8.2% |
| Immigrants | Japan | 100.0 /100 | #55 | Exceptional 8.2% |
| Immigrants | Bosnia and Herzegovina | 100.0 /100 | #56 | Exceptional 8.2% |
| Immigrants | Laos | 100.0 /100 | #57 | Exceptional 8.2% |
| Immigrants | Malaysia | 100.0 /100 | #58 | Exceptional 8.2% |
| Immigrants | Philippines | 100.0 /100 | #59 | Exceptional 8.2% |
| Basques | 100.0 /100 | #60 | Exceptional 8.2% |
| Koreans | 100.0 /100 | #61 | Exceptional 8.2% |
| Spanish American Indians | 100.0 /100 | #62 | Exceptional 8.2% |
| Immigrants | South Eastern Asia | 99.9 /100 | #63 | Exceptional 8.2% |
| Immigrants | Kuwait | 99.9 /100 | #64 | Exceptional 8.3% |
| Immigrants | Albania | 99.9 /100 | #65 | Exceptional 8.3% |
Demographics Similar to Lebanese by Unemployment Among Women with Children Ages 6 to 17 years
In terms of unemployment among women with children ages 6 to 17 years, the demographic groups most similar to Lebanese are Senegalese (9.5%, a difference of 0.040%), South American (9.5%, a difference of 0.090%), Italian (9.5%, a difference of 0.18%), Immigrants from Ghana (9.5%, a difference of 0.24%), and West Indian (9.5%, a difference of 0.27%).
| Demographics | Rating | Rank | Unemployment Among Women with Children Ages 6 to 17 years |
| Canadians | 0.8 /100 | #256 | Tragic 9.4% |
| Celtics | 0.7 /100 | #257 | Tragic 9.5% |
| Immigrants | Mexico | 0.7 /100 | #258 | Tragic 9.5% |
| Immigrants | Central America | 0.6 /100 | #259 | Tragic 9.5% |
| Italians | 0.6 /100 | #260 | Tragic 9.5% |
| South Americans | 0.5 /100 | #261 | Tragic 9.5% |
| Senegalese | 0.5 /100 | #262 | Tragic 9.5% |
| Lebanese | 0.5 /100 | #263 | Tragic 9.5% |
| Immigrants | Ghana | 0.4 /100 | #264 | Tragic 9.5% |
| West Indians | 0.4 /100 | #265 | Tragic 9.5% |
| Immigrants | Jamaica | 0.3 /100 | #266 | Tragic 9.5% |
| Irish | 0.3 /100 | #267 | Tragic 9.5% |
| Ghanaians | 0.2 /100 | #268 | Tragic 9.6% |
| Blackfeet | 0.2 /100 | #269 | Tragic 9.6% |
| Immigrants | Nicaragua | 0.2 /100 | #270 | Tragic 9.6% |