Ecuadorian vs Scottish Unemployment Among Women with Children Ages 6 to 17 years
COMPARE
Ecuadorian
Scottish
Unemployment Among Women with Children Ages 6 to 17 years
Unemployment Among Women with Children Ages 6 to 17 years Comparison
Ecuadorians
Scottish
10.0%
UNEMPLOYMENT AMONG WOMEN WITH CHILDREN AGES 6 TO 17 YEARS
0.0/ 100
METRIC RATING
294th/ 347
METRIC RANK
9.4%
UNEMPLOYMENT AMONG WOMEN WITH CHILDREN AGES 6 TO 17 YEARS
2.0/ 100
METRIC RATING
243rd/ 347
METRIC RANK
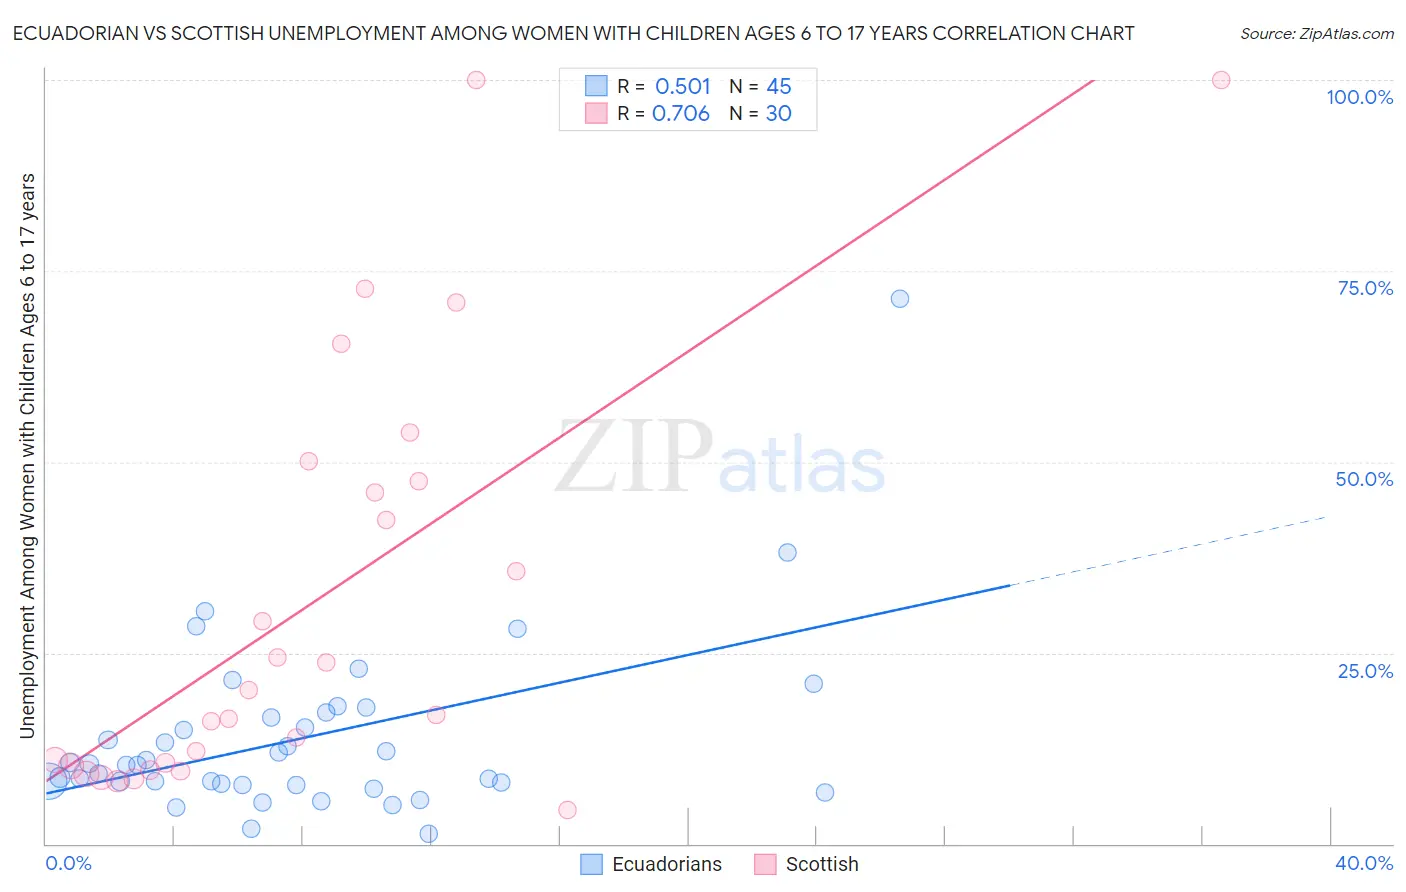
Ecuadorian vs Scottish Unemployment Among Women with Children Ages 6 to 17 years Correlation Chart
The statistical analysis conducted on geographies consisting of 242,852,218 people shows a substantial positive correlation between the proportion of Ecuadorians and unemployment rate among women with children between the ages 6 and 17 in the United States with a correlation coefficient (R) of 0.501 and weighted average of 10.0%. Similarly, the statistical analysis conducted on geographies consisting of 354,178,557 people shows a strong positive correlation between the proportion of Scottish and unemployment rate among women with children between the ages 6 and 17 in the United States with a correlation coefficient (R) of 0.706 and weighted average of 9.4%, a difference of 7.2%.
Unemployment Among Women with Children Ages 6 to 17 years Correlation Summary
| Measurement | Ecuadorian | Scottish |
| Minimum | 1.3% | 4.5% |
| Maximum | 71.4% | 100.0% |
| Range | 70.1% | 95.5% |
| Mean | 13.8% | 31.6% |
| Median | 10.3% | 18.5% |
| Interquartile 25% (IQ1) | 7.8% | 10.1% |
| Interquartile 75% (IQ3) | 16.8% | 47.4% |
| Interquartile Range (IQR) | 9.0% | 37.3% |
| Standard Deviation (Sample) | 11.7% | 27.5% |
| Standard Deviation (Population) | 11.6% | 27.0% |
Similar Demographics by Unemployment Among Women with Children Ages 6 to 17 years
Demographics Similar to Ecuadorians by Unemployment Among Women with Children Ages 6 to 17 years
In terms of unemployment among women with children ages 6 to 17 years, the demographic groups most similar to Ecuadorians are Cherokee (10.0%, a difference of 0.030%), Haitian (10.0%, a difference of 0.090%), Carpatho Rusyn (10.0%, a difference of 0.18%), Nonimmigrants (10.0%, a difference of 0.19%), and Subsaharan African (10.0%, a difference of 0.22%).
| Demographics | Rating | Rank | Unemployment Among Women with Children Ages 6 to 17 years |
| Sierra Leoneans | 0.0 /100 | #287 | Tragic 9.9% |
| Shoshone | 0.0 /100 | #288 | Tragic 10.0% |
| Hondurans | 0.0 /100 | #289 | Tragic 10.0% |
| Sub-Saharan Africans | 0.0 /100 | #290 | Tragic 10.0% |
| Immigrants | Nonimmigrants | 0.0 /100 | #291 | Tragic 10.0% |
| Carpatho Rusyns | 0.0 /100 | #292 | Tragic 10.0% |
| Haitians | 0.0 /100 | #293 | Tragic 10.0% |
| Ecuadorians | 0.0 /100 | #294 | Tragic 10.0% |
| Cherokee | 0.0 /100 | #295 | Tragic 10.0% |
| Immigrants | Western Africa | 0.0 /100 | #296 | Tragic 10.1% |
| Immigrants | Caribbean | 0.0 /100 | #297 | Tragic 10.1% |
| Immigrants | Haiti | 0.0 /100 | #298 | Tragic 10.1% |
| Immigrants | Honduras | 0.0 /100 | #299 | Tragic 10.1% |
| Nigerians | 0.0 /100 | #300 | Tragic 10.1% |
| Immigrants | Bahamas | 0.0 /100 | #301 | Tragic 10.1% |
Demographics Similar to Scottish by Unemployment Among Women with Children Ages 6 to 17 years
In terms of unemployment among women with children ages 6 to 17 years, the demographic groups most similar to Scottish are English (9.4%, a difference of 0.050%), Immigrants from Cameroon (9.4%, a difference of 0.080%), Immigrants from Colombia (9.3%, a difference of 0.090%), Colombian (9.3%, a difference of 0.11%), and Guatemalan (9.3%, a difference of 0.18%).
| Demographics | Rating | Rank | Unemployment Among Women with Children Ages 6 to 17 years |
| Hungarians | 3.0 /100 | #236 | Tragic 9.3% |
| Immigrants | Belize | 2.8 /100 | #237 | Tragic 9.3% |
| Arabs | 2.7 /100 | #238 | Tragic 9.3% |
| Immigrants | Saudi Arabia | 2.7 /100 | #239 | Tragic 9.3% |
| Guatemalans | 2.3 /100 | #240 | Tragic 9.3% |
| Colombians | 2.2 /100 | #241 | Tragic 9.3% |
| Immigrants | Colombia | 2.1 /100 | #242 | Tragic 9.3% |
| Scottish | 2.0 /100 | #243 | Tragic 9.4% |
| English | 1.9 /100 | #244 | Tragic 9.4% |
| Immigrants | Cameroon | 1.8 /100 | #245 | Tragic 9.4% |
| Immigrants | Africa | 1.6 /100 | #246 | Tragic 9.4% |
| Poles | 1.5 /100 | #247 | Tragic 9.4% |
| Dutch | 1.5 /100 | #248 | Tragic 9.4% |
| Immigrants | South America | 1.5 /100 | #249 | Tragic 9.4% |
| Immigrants | Guatemala | 1.3 /100 | #250 | Tragic 9.4% |