Immigrants from Malaysia vs Immigrants from Lebanon Unemployment Among Women with Children Ages 6 to 17 years
COMPARE
Immigrants from Malaysia
Immigrants from Lebanon
Unemployment Among Women with Children Ages 6 to 17 years
Unemployment Among Women with Children Ages 6 to 17 years Comparison
Immigrants from Malaysia
Immigrants from Lebanon
8.2%
UNEMPLOYMENT AMONG WOMEN WITH CHILDREN AGES 6 TO 17 YEARS
100.0/ 100
METRIC RATING
58th/ 347
METRIC RANK
8.7%
UNEMPLOYMENT AMONG WOMEN WITH CHILDREN AGES 6 TO 17 YEARS
94.9/ 100
METRIC RATING
124th/ 347
METRIC RANK
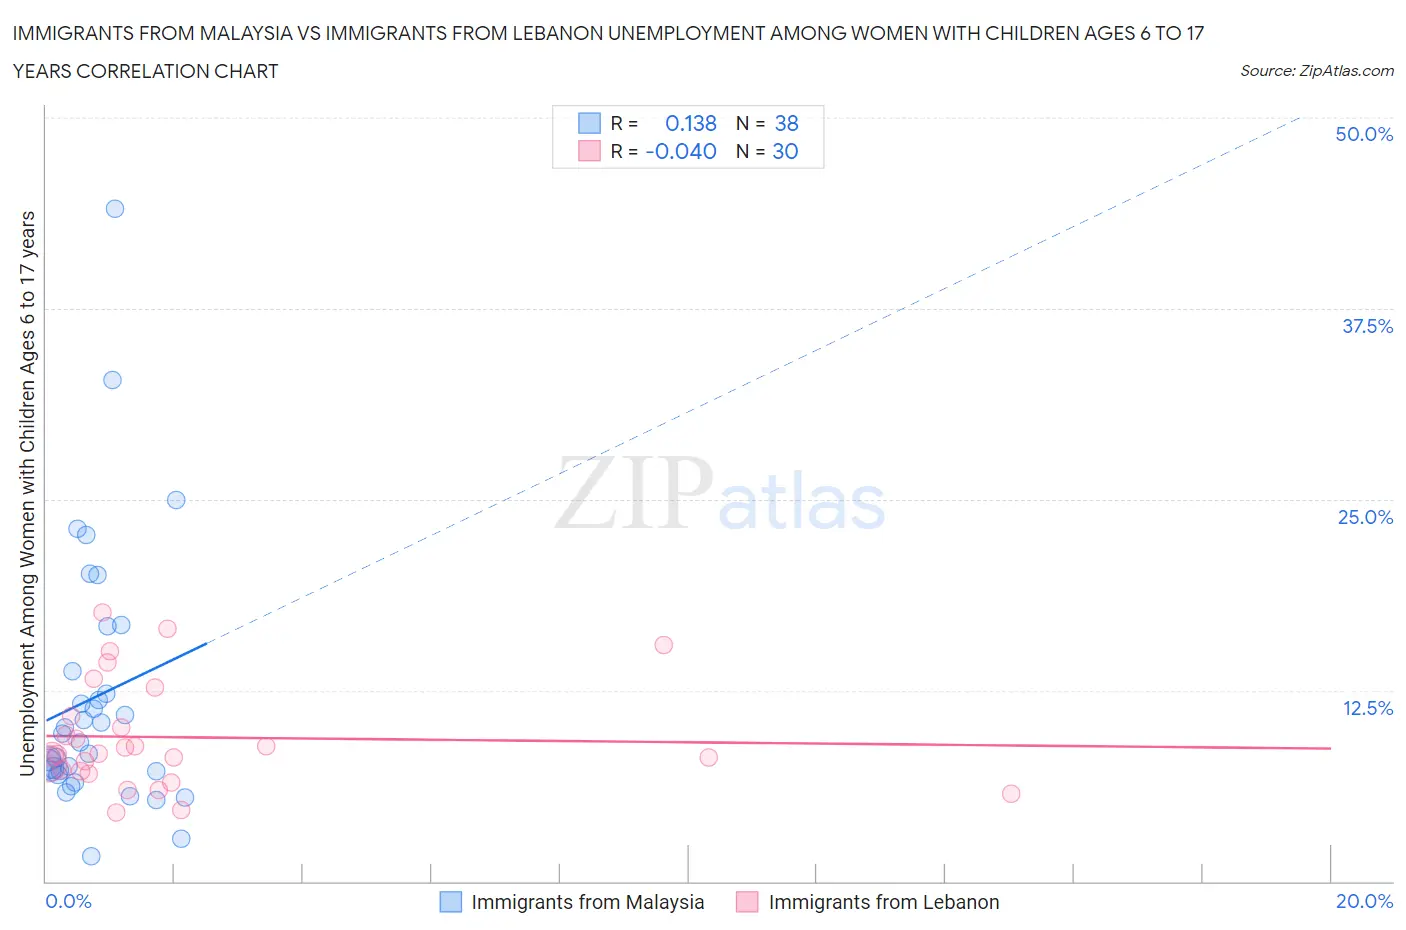
Immigrants from Malaysia vs Immigrants from Lebanon Unemployment Among Women with Children Ages 6 to 17 years Correlation Chart
The statistical analysis conducted on geographies consisting of 160,783,696 people shows a poor positive correlation between the proportion of Immigrants from Malaysia and unemployment rate among women with children between the ages 6 and 17 in the United States with a correlation coefficient (R) of 0.138 and weighted average of 8.2%. Similarly, the statistical analysis conducted on geographies consisting of 171,151,973 people shows no correlation between the proportion of Immigrants from Lebanon and unemployment rate among women with children between the ages 6 and 17 in the United States with a correlation coefficient (R) of -0.040 and weighted average of 8.7%, a difference of 6.1%.
Unemployment Among Women with Children Ages 6 to 17 years Correlation Summary
| Measurement | Immigrants from Malaysia | Immigrants from Lebanon |
| Minimum | 1.6% | 4.5% |
| Maximum | 44.0% | 17.6% |
| Range | 42.4% | 13.1% |
| Mean | 12.0% | 9.4% |
| Median | 9.4% | 8.3% |
| Interquartile 25% (IQ1) | 7.2% | 7.2% |
| Interquartile 75% (IQ3) | 13.8% | 10.8% |
| Interquartile Range (IQR) | 6.6% | 3.7% |
| Standard Deviation (Sample) | 8.5% | 3.5% |
| Standard Deviation (Population) | 8.4% | 3.5% |
Similar Demographics by Unemployment Among Women with Children Ages 6 to 17 years
Demographics Similar to Immigrants from Malaysia by Unemployment Among Women with Children Ages 6 to 17 years
In terms of unemployment among women with children ages 6 to 17 years, the demographic groups most similar to Immigrants from Malaysia are Immigrants from Philippines (8.2%, a difference of 0.060%), Basque (8.2%, a difference of 0.070%), Immigrants from Laos (8.2%, a difference of 0.19%), Immigrants from Bosnia and Herzegovina (8.2%, a difference of 0.21%), and Immigrants from Japan (8.2%, a difference of 0.23%).
| Demographics | Rating | Rank | Unemployment Among Women with Children Ages 6 to 17 years |
| Immigrants | Sudan | 100.0 /100 | #51 | Exceptional 8.1% |
| Immigrants | Iraq | 100.0 /100 | #52 | Exceptional 8.1% |
| Danes | 100.0 /100 | #53 | Exceptional 8.1% |
| Immigrants | Armenia | 100.0 /100 | #54 | Exceptional 8.2% |
| Immigrants | Japan | 100.0 /100 | #55 | Exceptional 8.2% |
| Immigrants | Bosnia and Herzegovina | 100.0 /100 | #56 | Exceptional 8.2% |
| Immigrants | Laos | 100.0 /100 | #57 | Exceptional 8.2% |
| Immigrants | Malaysia | 100.0 /100 | #58 | Exceptional 8.2% |
| Immigrants | Philippines | 100.0 /100 | #59 | Exceptional 8.2% |
| Basques | 100.0 /100 | #60 | Exceptional 8.2% |
| Koreans | 100.0 /100 | #61 | Exceptional 8.2% |
| Spanish American Indians | 100.0 /100 | #62 | Exceptional 8.2% |
| Immigrants | South Eastern Asia | 99.9 /100 | #63 | Exceptional 8.2% |
| Immigrants | Kuwait | 99.9 /100 | #64 | Exceptional 8.3% |
| Immigrants | Albania | 99.9 /100 | #65 | Exceptional 8.3% |
Demographics Similar to Immigrants from Lebanon by Unemployment Among Women with Children Ages 6 to 17 years
In terms of unemployment among women with children ages 6 to 17 years, the demographic groups most similar to Immigrants from Lebanon are Immigrants from Morocco (8.7%, a difference of 0.0%), Immigrants from Egypt (8.7%, a difference of 0.040%), South African (8.7%, a difference of 0.070%), Immigrants from Northern Africa (8.7%, a difference of 0.10%), and Czech (8.7%, a difference of 0.10%).
| Demographics | Rating | Rank | Unemployment Among Women with Children Ages 6 to 17 years |
| Albanians | 96.3 /100 | #117 | Exceptional 8.6% |
| Pueblo | 96.2 /100 | #118 | Exceptional 8.6% |
| Immigrants | Grenada | 96.2 /100 | #119 | Exceptional 8.6% |
| Israelis | 95.9 /100 | #120 | Exceptional 8.7% |
| Immigrants | Denmark | 95.5 /100 | #121 | Exceptional 8.7% |
| Immigrants | Egypt | 95.0 /100 | #122 | Exceptional 8.7% |
| Immigrants | Morocco | 94.9 /100 | #123 | Exceptional 8.7% |
| Immigrants | Lebanon | 94.9 /100 | #124 | Exceptional 8.7% |
| South Africans | 94.6 /100 | #125 | Exceptional 8.7% |
| Immigrants | Northern Africa | 94.4 /100 | #126 | Exceptional 8.7% |
| Czechs | 94.4 /100 | #127 | Exceptional 8.7% |
| Hmong | 94.3 /100 | #128 | Exceptional 8.7% |
| Barbadians | 93.8 /100 | #129 | Exceptional 8.7% |
| Immigrants | Western Asia | 93.1 /100 | #130 | Exceptional 8.7% |
| Slavs | 92.2 /100 | #131 | Exceptional 8.7% |