Immigrants from Laos vs Guyanese Male Unemployment
COMPARE
Immigrants from Laos
Guyanese
Male Unemployment
Male Unemployment Comparison
Immigrants from Laos
Guyanese
5.4%
MALE UNEMPLOYMENT
13.0/ 100
METRIC RATING
203rd/ 347
METRIC RANK
7.1%
MALE UNEMPLOYMENT
0.0/ 100
METRIC RATING
317th/ 347
METRIC RANK
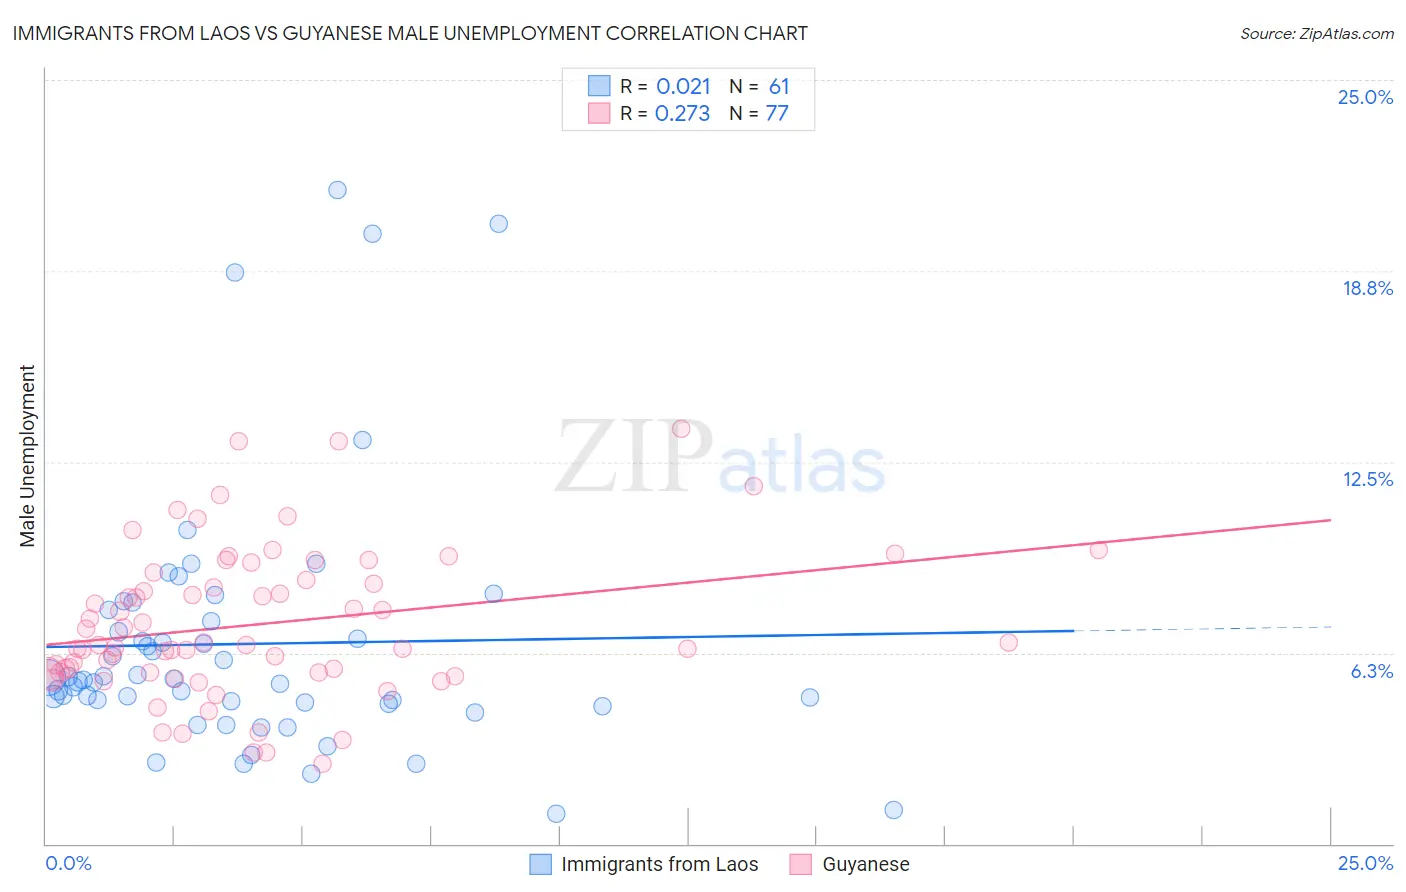
Immigrants from Laos vs Guyanese Male Unemployment Correlation Chart
The statistical analysis conducted on geographies consisting of 201,122,533 people shows no correlation between the proportion of Immigrants from Laos and unemployment rate among males in the United States with a correlation coefficient (R) of 0.021 and weighted average of 5.4%. Similarly, the statistical analysis conducted on geographies consisting of 176,637,764 people shows a weak positive correlation between the proportion of Guyanese and unemployment rate among males in the United States with a correlation coefficient (R) of 0.273 and weighted average of 7.1%, a difference of 30.8%.
Male Unemployment Correlation Summary
| Measurement | Immigrants from Laos | Guyanese |
| Minimum | 1.0% | 2.6% |
| Maximum | 21.4% | 13.6% |
| Range | 20.4% | 11.0% |
| Mean | 6.5% | 7.2% |
| Median | 5.4% | 6.5% |
| Interquartile 25% (IQ1) | 4.6% | 5.6% |
| Interquartile 75% (IQ3) | 7.5% | 8.8% |
| Interquartile Range (IQR) | 2.9% | 3.2% |
| Standard Deviation (Sample) | 4.2% | 2.4% |
| Standard Deviation (Population) | 4.2% | 2.4% |
Similar Demographics by Male Unemployment
Demographics Similar to Immigrants from Laos by Male Unemployment
In terms of male unemployment, the demographic groups most similar to Immigrants from Laos are Nonimmigrants (5.4%, a difference of 0.010%), Immigrants from Philippines (5.4%, a difference of 0.050%), Immigrants from Zaire (5.4%, a difference of 0.080%), Guamanian/Chamorro (5.4%, a difference of 0.090%), and Immigrants from Greece (5.4%, a difference of 0.18%).
| Demographics | Rating | Rank | Male Unemployment |
| Albanians | 17.3 /100 | #196 | Poor 5.4% |
| Alsatians | 16.7 /100 | #197 | Poor 5.4% |
| Immigrants | Thailand | 14.7 /100 | #198 | Poor 5.4% |
| Immigrants | Greece | 14.5 /100 | #199 | Poor 5.4% |
| Immigrants | Zaire | 13.7 /100 | #200 | Poor 5.4% |
| Immigrants | Philippines | 13.5 /100 | #201 | Poor 5.4% |
| Immigrants | Nonimmigrants | 13.1 /100 | #202 | Poor 5.4% |
| Immigrants | Laos | 13.0 /100 | #203 | Poor 5.4% |
| Guamanians/Chamorros | 12.3 /100 | #204 | Poor 5.4% |
| Immigrants | Costa Rica | 11.4 /100 | #205 | Poor 5.5% |
| Immigrants | Ukraine | 9.9 /100 | #206 | Tragic 5.5% |
| Immigrants | Syria | 9.3 /100 | #207 | Tragic 5.5% |
| Immigrants | Lebanon | 8.6 /100 | #208 | Tragic 5.5% |
| Immigrants | Middle Africa | 8.3 /100 | #209 | Tragic 5.5% |
| South American Indians | 7.6 /100 | #210 | Tragic 5.5% |
Demographics Similar to Guyanese by Male Unemployment
In terms of male unemployment, the demographic groups most similar to Guyanese are Immigrants from Guyana (7.1%, a difference of 0.060%), Cape Verdean (7.1%, a difference of 0.070%), Houma (7.1%, a difference of 0.080%), Immigrants from Barbados (7.1%, a difference of 0.30%), and Immigrants from Dominica (7.0%, a difference of 1.6%).
| Demographics | Rating | Rank | Male Unemployment |
| Blacks/African Americans | 0.0 /100 | #310 | Tragic 6.9% |
| Immigrants | Armenia | 0.0 /100 | #311 | Tragic 6.9% |
| Lumbee | 0.0 /100 | #312 | Tragic 6.9% |
| Immigrants | Dominica | 0.0 /100 | #313 | Tragic 7.0% |
| Immigrants | Barbados | 0.0 /100 | #314 | Tragic 7.1% |
| Houma | 0.0 /100 | #315 | Tragic 7.1% |
| Immigrants | Guyana | 0.0 /100 | #316 | Tragic 7.1% |
| Guyanese | 0.0 /100 | #317 | Tragic 7.1% |
| Cape Verdeans | 0.0 /100 | #318 | Tragic 7.1% |
| British West Indians | 0.0 /100 | #319 | Tragic 7.3% |
| Colville | 0.0 /100 | #320 | Tragic 7.4% |
| Immigrants | St. Vincent and the Grenadines | 0.0 /100 | #321 | Tragic 7.5% |
| Immigrants | Cabo Verde | 0.0 /100 | #322 | Tragic 7.5% |
| Immigrants | Grenada | 0.0 /100 | #323 | Tragic 7.6% |
| Dominicans | 0.0 /100 | #324 | Tragic 7.6% |