Immigrants from Mexico vs Guyanese Unemployment
COMPARE
Immigrants from Mexico
Guyanese
Unemployment
Unemployment Comparison
Immigrants from Mexico
Guyanese
6.0%
UNEMPLOYMENT
0.0/ 100
METRIC RATING
279th/ 347
METRIC RANK
6.9%
UNEMPLOYMENT
0.0/ 100
METRIC RATING
322nd/ 347
METRIC RANK
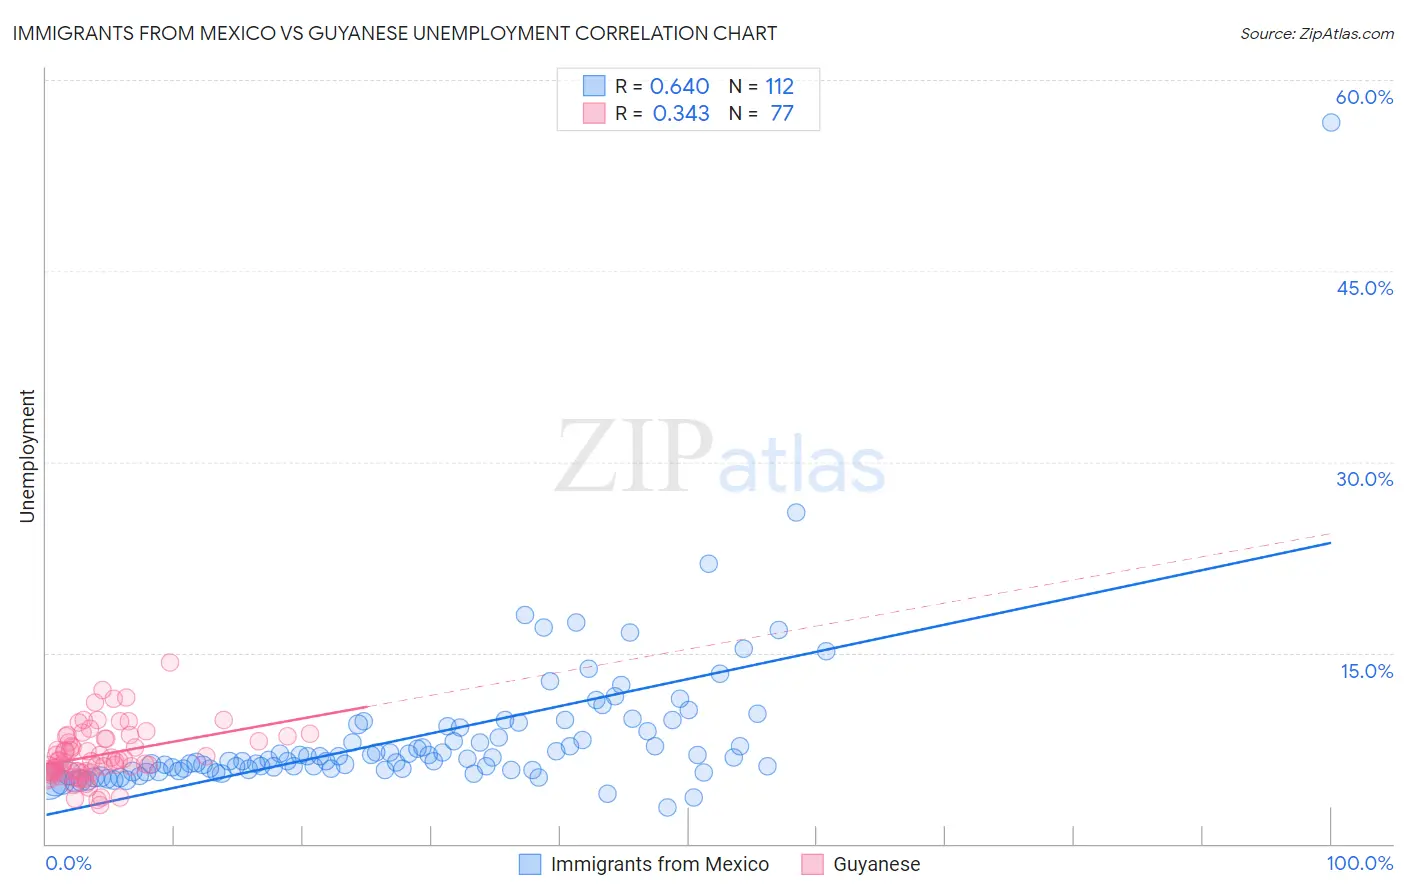
Immigrants from Mexico vs Guyanese Unemployment Correlation Chart
The statistical analysis conducted on geographies consisting of 511,903,872 people shows a significant positive correlation between the proportion of Immigrants from Mexico and unemployment in the United States with a correlation coefficient (R) of 0.640 and weighted average of 6.0%. Similarly, the statistical analysis conducted on geographies consisting of 176,860,990 people shows a mild positive correlation between the proportion of Guyanese and unemployment in the United States with a correlation coefficient (R) of 0.343 and weighted average of 6.9%, a difference of 14.5%.
Unemployment Correlation Summary
| Measurement | Immigrants from Mexico | Guyanese |
| Minimum | 2.8% | 3.0% |
| Maximum | 56.6% | 14.2% |
| Range | 53.8% | 11.2% |
| Mean | 8.4% | 7.0% |
| Median | 6.6% | 6.5% |
| Interquartile 25% (IQ1) | 5.8% | 5.6% |
| Interquartile 75% (IQ3) | 9.2% | 8.3% |
| Interquartile Range (IQR) | 3.4% | 2.7% |
| Standard Deviation (Sample) | 6.0% | 2.1% |
| Standard Deviation (Population) | 5.9% | 2.1% |
Similar Demographics by Unemployment
Demographics Similar to Immigrants from Mexico by Unemployment
In terms of unemployment, the demographic groups most similar to Immigrants from Mexico are Immigrants from Western Africa (6.0%, a difference of 0.0%), Ghanaian (6.0%, a difference of 0.43%), African (6.1%, a difference of 0.58%), Immigrants from the Azores (6.1%, a difference of 0.65%), and Armenian (6.0%, a difference of 0.72%).
| Demographics | Rating | Rank | Unemployment |
| Hispanics or Latinos | 0.0 /100 | #272 | Tragic 5.9% |
| Immigrants | Fiji | 0.0 /100 | #273 | Tragic 5.9% |
| Bahamians | 0.0 /100 | #274 | Tragic 5.9% |
| Immigrants | Latin America | 0.0 /100 | #275 | Tragic 5.9% |
| Immigrants | Central America | 0.0 /100 | #276 | Tragic 6.0% |
| Armenians | 0.0 /100 | #277 | Tragic 6.0% |
| Ghanaians | 0.0 /100 | #278 | Tragic 6.0% |
| Immigrants | Mexico | 0.0 /100 | #279 | Tragic 6.0% |
| Immigrants | Western Africa | 0.0 /100 | #280 | Tragic 6.0% |
| Africans | 0.0 /100 | #281 | Tragic 6.1% |
| Immigrants | Azores | 0.0 /100 | #282 | Tragic 6.1% |
| Immigrants | Ghana | 0.0 /100 | #283 | Tragic 6.1% |
| Aleuts | 0.0 /100 | #284 | Tragic 6.1% |
| Immigrants | Senegal | 0.0 /100 | #285 | Tragic 6.1% |
| Immigrants | Caribbean | 0.0 /100 | #286 | Tragic 6.2% |
Demographics Similar to Guyanese by Unemployment
In terms of unemployment, the demographic groups most similar to Guyanese are Immigrants from Guyana (6.9%, a difference of 0.040%), Immigrants from St. Vincent and the Grenadines (6.9%, a difference of 0.050%), Immigrants from Grenada (6.9%, a difference of 0.32%), British West Indian (6.8%, a difference of 0.85%), and Immigrants from Cabo Verde (6.8%, a difference of 1.1%).
| Demographics | Rating | Rank | Unemployment |
| Houma | 0.0 /100 | #315 | Tragic 6.7% |
| Immigrants | Dominica | 0.0 /100 | #316 | Tragic 6.7% |
| Shoshone | 0.0 /100 | #317 | Tragic 6.8% |
| Immigrants | Cabo Verde | 0.0 /100 | #318 | Tragic 6.8% |
| British West Indians | 0.0 /100 | #319 | Tragic 6.8% |
| Immigrants | St. Vincent and the Grenadines | 0.0 /100 | #320 | Tragic 6.9% |
| Immigrants | Guyana | 0.0 /100 | #321 | Tragic 6.9% |
| Guyanese | 0.0 /100 | #322 | Tragic 6.9% |
| Immigrants | Grenada | 0.0 /100 | #323 | Tragic 6.9% |
| Immigrants | Armenia | 0.0 /100 | #324 | Tragic 7.0% |
| Natives/Alaskans | 0.0 /100 | #325 | Tragic 7.0% |
| Paiute | 0.0 /100 | #326 | Tragic 7.1% |
| Pueblo | 0.0 /100 | #327 | Tragic 7.2% |
| Tsimshian | 0.0 /100 | #328 | Tragic 7.2% |
| Alaska Natives | 0.0 /100 | #329 | Tragic 7.2% |