Immigrants from Ireland vs Immigrants from Liberia Female Unemployment

COMPARE

Immigrants from Ireland
Race
Ancestry
AfghanAfricanAlaska NativeAlaskan AthabascanAlbanianAleutAlsatianAmericanApacheArabArapahoArgentineanArmenianAssyrian/Chaldean/SyriacAustralianAustrianBahamianBangladeshiBarbadianBasqueBelgianBelizeanBermudanBhutaneseBlackfeetBolivianBrazilianBritishBritish West IndianBulgarianBurmeseCajunCambodianCanadianCape VerdeanCarpatho RusynCelticCentral AmericanCentral American IndianCherokeeCheyenneChickasawChileanChineseChippewaChoctawColombianColvilleComancheCosta RicanCreeCreekCroatianCrowCubanCypriotCzechCzechoslovakianDanishDelawareDominicanDutchDutch West IndianEastern EuropeanEcuadorianEgyptianEnglishEstonianEthiopianEuropeanFijianFilipinoFinnishFrenchFrench American IndianFrench CanadianGermanGerman RussianGhanaianGreekGuamanian/ChamorroGuatemalanGuyaneseHaitianHmongHonduranHopiHoumaHungarianIcelanderIndian (Asian)IndonesianInupiatIranianIraqiIrishIroquoisIsraeliItalianJamaicanJapaneseJordanianKenyanKiowaKoreanLaotianLatvianLebaneseLiberianLithuanianLumbeeLuxembourgerMacedonianMalaysianMalteseMarshalleseMenomineeMexicanMexican American IndianMongolianMoroccanNative HawaiianNavajoNepaleseNew ZealanderNicaraguanNigerianNorthern EuropeanNorwegianOkinawanOsageOttawaPaiutePakistaniPalestinianPanamanianParaguayanPennsylvania GermanPeruvianPimaPolishPortuguesePotawatomiPuebloPuerto RicanPuget Sound SalishRomanianRussianSalvadoranSamoanScandinavianScotch-IrishScottishSeminoleSenegaleseSerbianShoshoneSierra LeoneanSiouxSlavicSlovakSloveneSomaliSouth AfricanSouth AmericanSouth American IndianSoviet UnionSpaniardSpanishSpanish AmericanSpanish American IndianSri LankanSubsaharan AfricanSudaneseSwedishSwissSyrianTaiwaneseThaiTlingit-HaidaTohono O'OdhamTonganTrinidadian and TobagonianTsimshianTurkishU.S. Virgin IslanderUgandanUkrainianUruguayanUteVenezuelanVietnameseWelshWest IndianYakamaYaquiYugoslavianYumanYup'ikZimbabwean
Immigration
NonimmigrantsImmigrantsAfghanistanAfricaAlbaniaArgentinaArmeniaAsiaAustraliaAustriaBahamasBangladeshBarbadosBelarusBelgiumBelizeBoliviaBosnia and HerzegovinaBrazilBulgariaBurma/MyanmarCabo VerdeCambodiaCameroonCanadaCaribbeanCentral AmericaChileChinaColombiaCongoCosta RicaCroatiaCubaCzechoslovakiaDenmarkDominicaDominican RepublicEastern AfricaEastern AsiaEastern EuropeEcuadorEgyptEl SalvadorEnglandEritreaEthiopiaEuropeFijiFranceGermanyGhanaGreeceGrenadaGuatemalaGuyanaHaitiHondurasHong KongHungaryIndiaIndonesiaIranIraqIrelandIsraelItalyJamaicaJapanJordanKazakhstanKenyaKoreaKuwaitLaosLatin AmericaLatviaLebanonLithuaniaMalaysiaMexicoMicronesiaMiddle AfricaMoldovaMoroccoNepalNetherlandsNicaraguaNigeriaNorth AmericaNorth MacedoniaNorthern AfricaNorthern EuropeNorwayOceaniaPakistanPanamaPeruPhilippinesPolandPortugalRomaniaRussiaSaudi ArabiaScotlandSenegalSerbiaSierra LeoneSingaporeSomaliaSouth AfricaSouth AmericaSouth Central AsiaSouth Eastern AsiaSouthern EuropeSpainSri LankaSt. Vincent and the GrenadinesSudanSwedenSwitzerlandSyriaTaiwanThailandTrinidad and TobagoTurkeyUgandaUkraineUruguayUzbekistanVenezuelaVietnamWest IndiesWestern AfricaWestern AsiaWestern EuropeYemenZaireZimbabweAzores
Immigrants from Liberia
Race
Ancestry
AfghanAfricanAlaska NativeAlaskan AthabascanAlbanianAleutAlsatianAmericanApacheArabArapahoArgentineanArmenianAssyrian/Chaldean/SyriacAustralianAustrianBahamianBangladeshiBarbadianBasqueBelgianBelizeanBermudanBhutaneseBlackfeetBolivianBrazilianBritishBritish West IndianBulgarianBurmeseCajunCambodianCanadianCape VerdeanCarpatho RusynCelticCentral AmericanCentral American IndianCherokeeCheyenneChickasawChileanChineseChippewaChoctawColombianColvilleComancheCosta RicanCreeCreekCroatianCrowCubanCypriotCzechCzechoslovakianDanishDelawareDominicanDutchDutch West IndianEastern EuropeanEcuadorianEgyptianEnglishEstonianEthiopianEuropeanFijianFilipinoFinnishFrenchFrench American IndianFrench CanadianGermanGerman RussianGhanaianGreekGuamanian/ChamorroGuatemalanGuyaneseHaitianHmongHonduranHopiHoumaHungarianIcelanderIndian (Asian)IndonesianInupiatIranianIraqiIrishIroquoisIsraeliItalianJamaicanJapaneseJordanianKenyanKiowaKoreanLaotianLatvianLebaneseLiberianLithuanianLumbeeLuxembourgerMacedonianMalaysianMalteseMarshalleseMenomineeMexicanMexican American IndianMongolianMoroccanNative HawaiianNavajoNepaleseNew ZealanderNicaraguanNigerianNorthern EuropeanNorwegianOkinawanOsageOttawaPaiutePakistaniPalestinianPanamanianParaguayanPennsylvania GermanPeruvianPimaPolishPortuguesePotawatomiPuebloPuerto RicanPuget Sound SalishRomanianRussianSalvadoranSamoanScandinavianScotch-IrishScottishSeminoleSenegaleseSerbianShoshoneSierra LeoneanSiouxSlavicSlovakSloveneSomaliSouth AfricanSouth AmericanSouth American IndianSoviet UnionSpaniardSpanishSpanish AmericanSpanish American IndianSri LankanSubsaharan AfricanSudaneseSwedishSwissSyrianTaiwaneseThaiTlingit-HaidaTohono O'OdhamTonganTrinidadian and TobagonianTsimshianTurkishU.S. Virgin IslanderUgandanUkrainianUruguayanUteVenezuelanVietnameseWelshWest IndianYakamaYaquiYugoslavianYumanYup'ikZimbabwean
Immigration
NonimmigrantsImmigrantsAfghanistanAfricaAlbaniaArgentinaArmeniaAsiaAustraliaAustriaBahamasBangladeshBarbadosBelarusBelgiumBelizeBoliviaBosnia and HerzegovinaBrazilBulgariaBurma/MyanmarCabo VerdeCambodiaCameroonCanadaCaribbeanCentral AmericaChileChinaColombiaCongoCosta RicaCroatiaCubaCzechoslovakiaDenmarkDominicaDominican RepublicEastern AfricaEastern AsiaEastern EuropeEcuadorEgyptEl SalvadorEnglandEritreaEthiopiaEuropeFijiFranceGermanyGhanaGreeceGrenadaGuatemalaGuyanaHaitiHondurasHong KongHungaryIndiaIndonesiaIranIraqIsraelItalyJamaicaJapanJordanKazakhstanKenyaKoreaKuwaitLaosLatin AmericaLatviaLebanonLiberiaLithuaniaMalaysiaMexicoMicronesiaMiddle AfricaMoldovaMoroccoNepalNetherlandsNicaraguaNigeriaNorth AmericaNorth MacedoniaNorthern AfricaNorthern EuropeNorwayOceaniaPakistanPanamaPeruPhilippinesPolandPortugalRomaniaRussiaSaudi ArabiaScotlandSenegalSerbiaSierra LeoneSingaporeSomaliaSouth AfricaSouth AmericaSouth Central AsiaSouth Eastern AsiaSouthern EuropeSpainSri LankaSt. Vincent and the GrenadinesSudanSwedenSwitzerlandSyriaTaiwanThailandTrinidad and TobagoTurkeyUgandaUkraineUruguayUzbekistanVenezuelaVietnamWest IndiesWestern AfricaWestern AsiaWestern EuropeYemenZaireZimbabweAzores
Female Unemployment
Income
Poverty
Unemployment
Labor Participation
Family Structure
Vehicle Availability
Education Level
Disability

Female Unemployment Comparison

Immigrants from Ireland

Immigrants from Liberia

Exceptional
Tragic
4.9%
FEMALE UNEMPLOYMENT
98.2/ 100
METRIC RATING
69th/ 347
METRIC RANK
5.6%
FEMALE UNEMPLOYMENT
1.5/ 100
METRIC RATING
244th/ 347
METRIC RANK

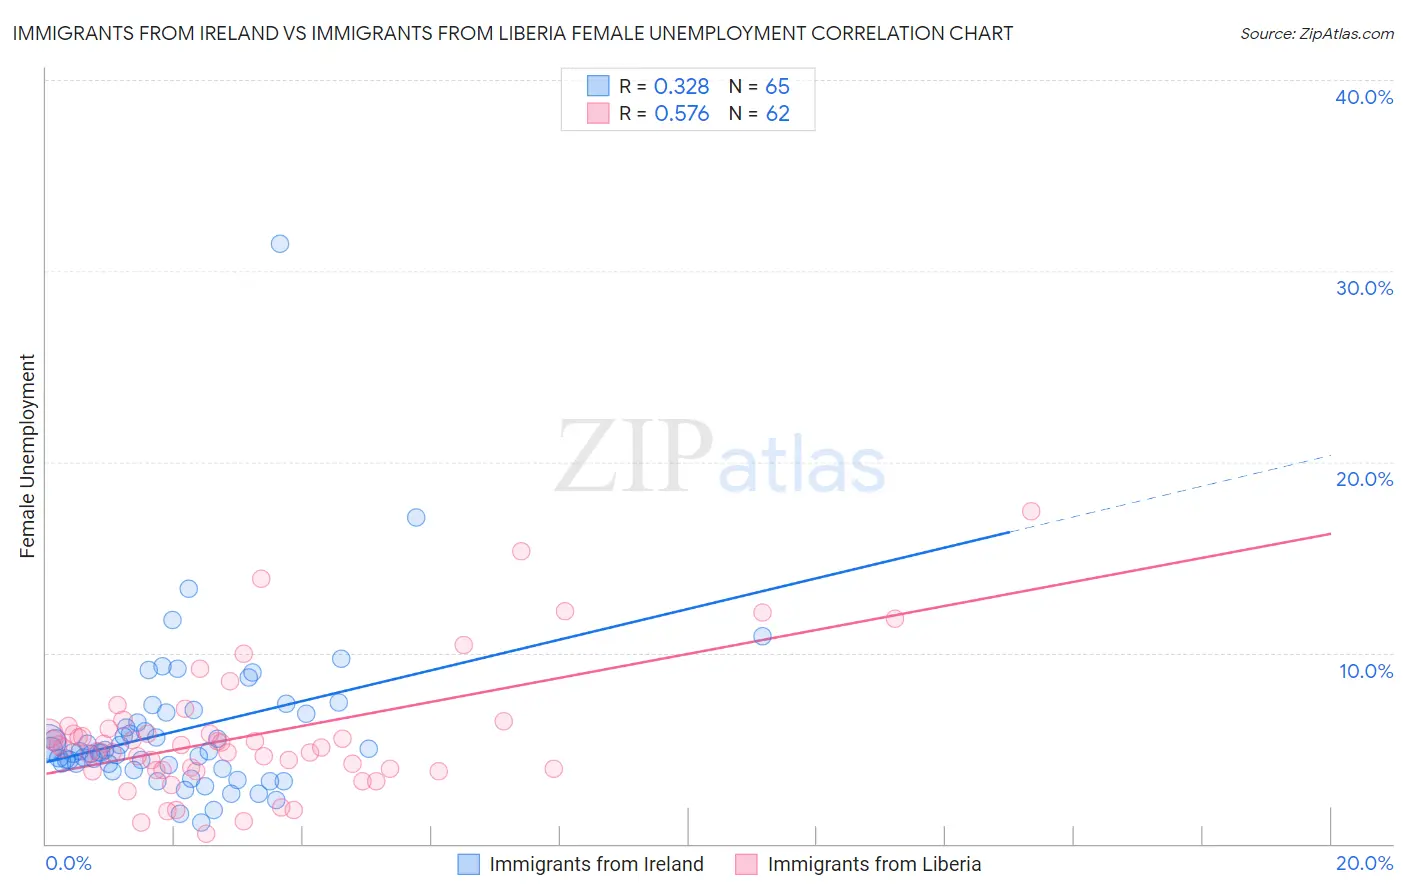
Immigrants from Ireland vs Immigrants from Liberia Female Unemployment Correlation Chart

The statistical analysis conducted on geographies consisting of 240,082,728 people shows a mild positive correlation between the proportion of Immigrants from Ireland and unemploymnet rate among females in the United States with a correlation coefficient (R) of 0.328 and weighted average of 4.9%. Similarly, the statistical analysis conducted on geographies consisting of 135,123,967 people shows a substantial positive correlation between the proportion of Immigrants from Liberia and unemploymnet rate among females in the United States with a correlation coefficient (R) of 0.576 and weighted average of 5.6%, a difference of 13.1%.
Immigrants from Ireland vs Immigrants from Liberia Female Unemployment

Female Unemployment Correlation Summary

MeasurementImmigrants from IrelandImmigrants from Liberia
Minimum1.1%0.50%
Maximum31.4%17.4%
Range30.3%16.9%
Mean5.9%5.7%
Median4.9%5.1%
Interquartile 25% (IQ1)4.0%3.9%
Interquartile 75% (IQ3)6.8%6.0%
Interquartile Range (IQR)2.8%2.2%
Standard Deviation (Sample)4.3%3.3%
Standard Deviation (Population)4.2%3.3%

Similar Demographics by Female Unemployment

Demographics Similar to Immigrants from Ireland by Female Unemployment

In terms of female unemployment, the demographic groups most similar to Immigrants from Ireland are Tlingit-Haida (4.9%, a difference of 0.010%), Hungarian (4.9%, a difference of 0.020%), Cuban (4.9%, a difference of 0.020%), Osage (4.9%, a difference of 0.040%), and Immigrants from North America (4.9%, a difference of 0.050%).
DemographicsRating | RankFemale Unemployment
Immigrants | Nepal
98.6
/100
|
#62
Exceptional
4.9%
Immigrants | Belgium
98.5
/100
|
#63
Exceptional
4.9%
Celtics
98.5
/100
|
#64
Exceptional
4.9%
Immigrants | North America
98.3
/100
|
#65
Exceptional
4.9%
Hungarians
98.3
/100
|
#66
Exceptional
4.9%
Cubans
98.3
/100
|
#67
Exceptional
4.9%
Tlingit-Haida
98.3
/100
|
#68
Exceptional
4.9%
Immigrants | Ireland
98.2
/100
|
#69
Exceptional
4.9%
Osage
98.2
/100
|
#70
Exceptional
4.9%
German Russians
98.1
/100
|
#71
Exceptional
4.9%
Immigrants | Northern Europe
98.0
/100
|
#72
Exceptional
4.9%
Russians
98.0
/100
|
#73
Exceptional
5.0%
Immigrants | Bolivia
98.0
/100
|
#74
Exceptional
5.0%
Immigrants | Singapore
98.0
/100
|
#75
Exceptional
5.0%
Immigrants | Venezuela
97.9
/100
|
#76
Exceptional
5.0%

Demographics Similar to Immigrants from Liberia by Female Unemployment

In terms of female unemployment, the demographic groups most similar to Immigrants from Liberia are Guamanian/Chamorro (5.6%, a difference of 0.14%), Japanese (5.6%, a difference of 0.37%), Immigrants from Western Asia (5.6%, a difference of 0.45%), Marshallese (5.6%, a difference of 0.55%), and Spanish American (5.6%, a difference of 0.55%).
DemographicsRating | RankFemale Unemployment
Immigrants | Panama
3.2
/100
|
#237
Tragic
5.5%
Sierra Leoneans
3.2
/100
|
#238
Tragic
5.5%
Aleuts
3.0
/100
|
#239
Tragic
5.5%
Immigrants | South America
2.9
/100
|
#240
Tragic
5.5%
South American Indians
2.8
/100
|
#241
Tragic
5.5%
Marshallese
2.3
/100
|
#242
Tragic
5.6%
Spanish Americans
2.2
/100
|
#243
Tragic
5.6%
Immigrants | Liberia
1.5
/100
|
#244
Tragic
5.6%
Guamanians/Chamorros
1.4
/100
|
#245
Tragic
5.6%
Japanese
1.2
/100
|
#246
Tragic
5.6%
Immigrants | Western Asia
1.1
/100
|
#247
Tragic
5.6%
Cree
1.0
/100
|
#248
Tragic
5.6%
Immigrants | Uzbekistan
1.0
/100
|
#249
Tragic
5.6%
Immigrants | Syria
0.8
/100
|
#250
Tragic
5.6%
Assyrians/Chaldeans/Syriacs
0.8
/100
|
#251
Tragic
5.6%