Immigrants from Ireland vs Alaska Native Female Unemployment
COMPARE
Immigrants from Ireland
Alaska Native
Female Unemployment
Female Unemployment Comparison
Immigrants from Ireland
Alaska Natives
4.9%
FEMALE UNEMPLOYMENT
98.2/ 100
METRIC RATING
69th/ 347
METRIC RANK
6.6%
FEMALE UNEMPLOYMENT
0.0/ 100
METRIC RATING
327th/ 347
METRIC RANK
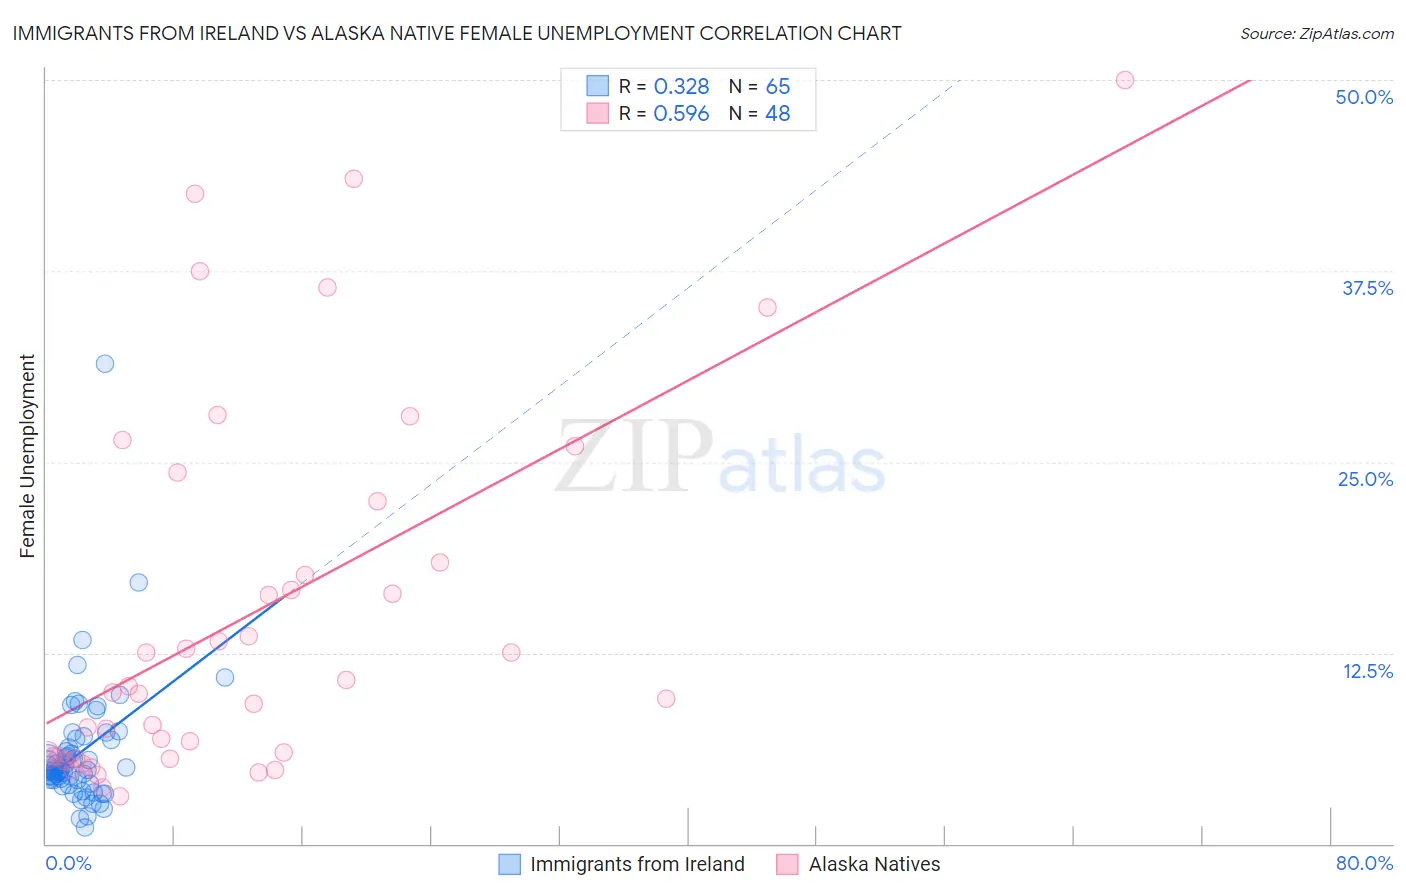
Immigrants from Ireland vs Alaska Native Female Unemployment Correlation Chart
The statistical analysis conducted on geographies consisting of 240,082,728 people shows a mild positive correlation between the proportion of Immigrants from Ireland and unemploymnet rate among females in the United States with a correlation coefficient (R) of 0.328 and weighted average of 4.9%. Similarly, the statistical analysis conducted on geographies consisting of 76,648,149 people shows a substantial positive correlation between the proportion of Alaska Natives and unemploymnet rate among females in the United States with a correlation coefficient (R) of 0.596 and weighted average of 6.6%, a difference of 34.3%.
Female Unemployment Correlation Summary
| Measurement | Immigrants from Ireland | Alaska Native |
| Minimum | 1.1% | 3.1% |
| Maximum | 31.4% | 50.0% |
| Range | 30.3% | 46.9% |
| Mean | 5.9% | 15.0% |
| Median | 4.9% | 10.1% |
| Interquartile 25% (IQ1) | 4.0% | 5.7% |
| Interquartile 75% (IQ3) | 6.8% | 20.4% |
| Interquartile Range (IQR) | 2.8% | 14.7% |
| Standard Deviation (Sample) | 4.3% | 12.1% |
| Standard Deviation (Population) | 4.2% | 12.0% |
Similar Demographics by Female Unemployment
Demographics Similar to Immigrants from Ireland by Female Unemployment
In terms of female unemployment, the demographic groups most similar to Immigrants from Ireland are Tlingit-Haida (4.9%, a difference of 0.010%), Hungarian (4.9%, a difference of 0.020%), Cuban (4.9%, a difference of 0.020%), Osage (4.9%, a difference of 0.040%), and Immigrants from North America (4.9%, a difference of 0.050%).
| Demographics | Rating | Rank | Female Unemployment |
| Immigrants | Nepal | 98.6 /100 | #62 | Exceptional 4.9% |
| Immigrants | Belgium | 98.5 /100 | #63 | Exceptional 4.9% |
| Celtics | 98.5 /100 | #64 | Exceptional 4.9% |
| Immigrants | North America | 98.3 /100 | #65 | Exceptional 4.9% |
| Hungarians | 98.3 /100 | #66 | Exceptional 4.9% |
| Cubans | 98.3 /100 | #67 | Exceptional 4.9% |
| Tlingit-Haida | 98.3 /100 | #68 | Exceptional 4.9% |
| Immigrants | Ireland | 98.2 /100 | #69 | Exceptional 4.9% |
| Osage | 98.2 /100 | #70 | Exceptional 4.9% |
| German Russians | 98.1 /100 | #71 | Exceptional 4.9% |
| Immigrants | Northern Europe | 98.0 /100 | #72 | Exceptional 4.9% |
| Russians | 98.0 /100 | #73 | Exceptional 5.0% |
| Immigrants | Bolivia | 98.0 /100 | #74 | Exceptional 5.0% |
| Immigrants | Singapore | 98.0 /100 | #75 | Exceptional 5.0% |
| Immigrants | Venezuela | 97.9 /100 | #76 | Exceptional 5.0% |
Demographics Similar to Alaska Natives by Female Unemployment
In terms of female unemployment, the demographic groups most similar to Alaska Natives are Native/Alaskan (6.6%, a difference of 0.090%), Guyanese (6.7%, a difference of 0.44%), Apache (6.6%, a difference of 0.64%), Immigrants from Guyana (6.7%, a difference of 0.80%), and Cheyenne (6.6%, a difference of 0.91%).
| Demographics | Rating | Rank | Female Unemployment |
| Immigrants | Dominica | 0.0 /100 | #320 | Tragic 6.5% |
| Blacks/African Americans | 0.0 /100 | #321 | Tragic 6.5% |
| Vietnamese | 0.0 /100 | #322 | Tragic 6.5% |
| Immigrants | Belize | 0.0 /100 | #323 | Tragic 6.5% |
| Cheyenne | 0.0 /100 | #324 | Tragic 6.6% |
| Apache | 0.0 /100 | #325 | Tragic 6.6% |
| Natives/Alaskans | 0.0 /100 | #326 | Tragic 6.6% |
| Alaska Natives | 0.0 /100 | #327 | Tragic 6.6% |
| Guyanese | 0.0 /100 | #328 | Tragic 6.7% |
| Immigrants | Guyana | 0.0 /100 | #329 | Tragic 6.7% |
| Yakama | 0.0 /100 | #330 | Tragic 6.7% |
| Paiute | 0.0 /100 | #331 | Tragic 6.8% |
| Sioux | 0.0 /100 | #332 | Tragic 7.0% |
| Menominee | 0.0 /100 | #333 | Tragic 7.0% |
| Immigrants | Armenia | 0.0 /100 | #334 | Tragic 7.1% |