Immigrants from Guyana vs Immigrants from Liberia Female Unemployment
COMPARE
Immigrants from Guyana
Immigrants from Liberia
Female Unemployment
Female Unemployment Comparison
Immigrants from Guyana
Immigrants from Liberia
6.7%
FEMALE UNEMPLOYMENT
0.0/ 100
METRIC RATING
329th/ 347
METRIC RANK
5.6%
FEMALE UNEMPLOYMENT
1.5/ 100
METRIC RATING
244th/ 347
METRIC RANK
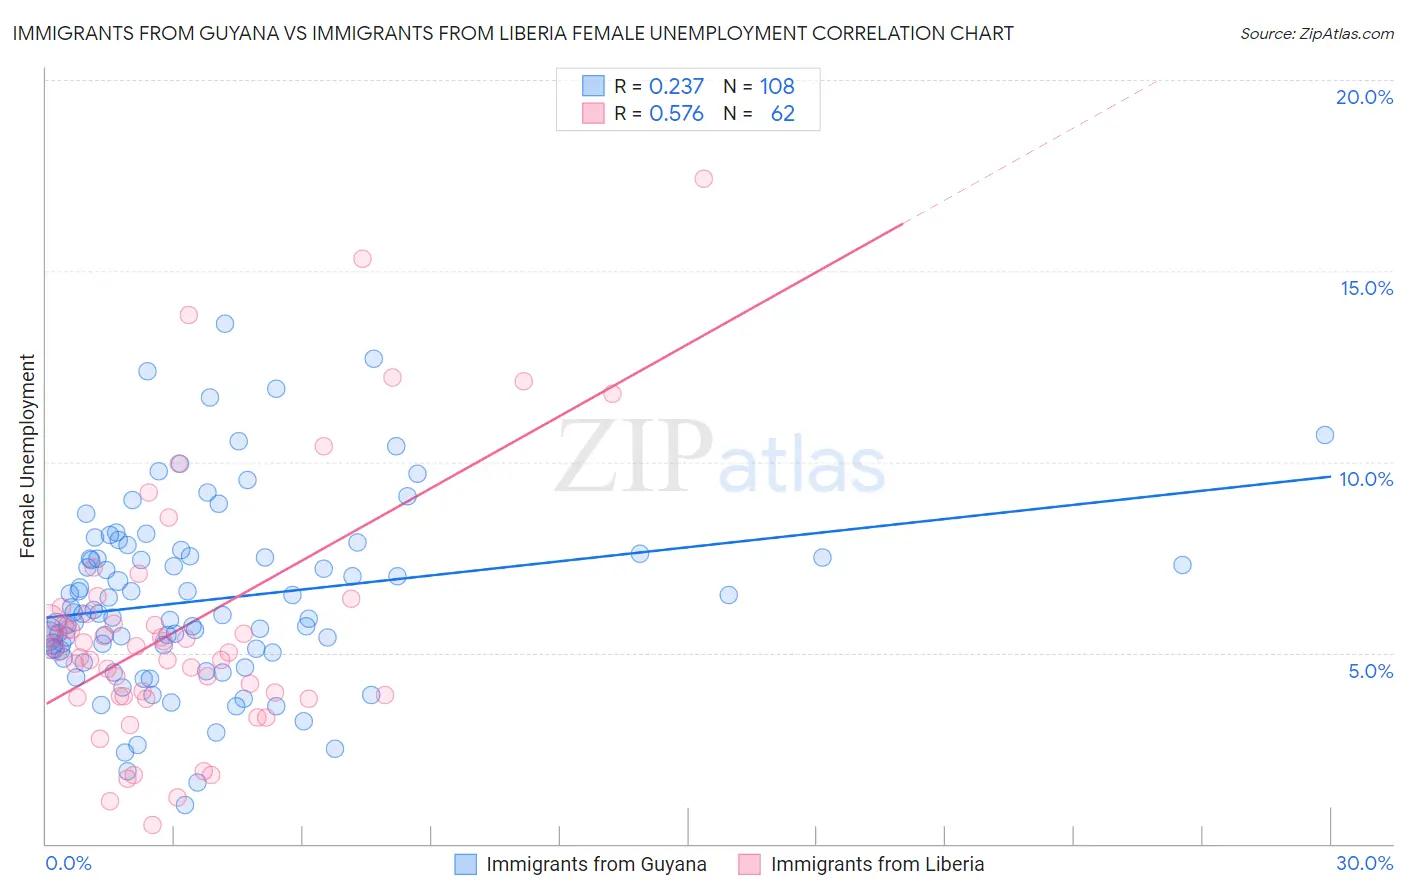
Immigrants from Guyana vs Immigrants from Liberia Female Unemployment Correlation Chart
The statistical analysis conducted on geographies consisting of 183,445,412 people shows a weak positive correlation between the proportion of Immigrants from Guyana and unemploymnet rate among females in the United States with a correlation coefficient (R) of 0.237 and weighted average of 6.7%. Similarly, the statistical analysis conducted on geographies consisting of 135,123,967 people shows a substantial positive correlation between the proportion of Immigrants from Liberia and unemploymnet rate among females in the United States with a correlation coefficient (R) of 0.576 and weighted average of 5.6%, a difference of 19.7%.
Female Unemployment Correlation Summary
| Measurement | Immigrants from Guyana | Immigrants from Liberia |
| Minimum | 1.0% | 0.50% |
| Maximum | 13.6% | 17.4% |
| Range | 12.6% | 16.9% |
| Mean | 6.4% | 5.7% |
| Median | 6.0% | 5.1% |
| Interquartile 25% (IQ1) | 5.1% | 3.9% |
| Interquartile 75% (IQ3) | 7.5% | 6.0% |
| Interquartile Range (IQR) | 2.4% | 2.2% |
| Standard Deviation (Sample) | 2.4% | 3.3% |
| Standard Deviation (Population) | 2.4% | 3.3% |
Similar Demographics by Female Unemployment
Demographics Similar to Immigrants from Guyana by Female Unemployment
In terms of female unemployment, the demographic groups most similar to Immigrants from Guyana are Guyanese (6.7%, a difference of 0.37%), Yakama (6.7%, a difference of 0.57%), Alaska Native (6.6%, a difference of 0.80%), Native/Alaskan (6.6%, a difference of 0.89%), and Apache (6.6%, a difference of 1.5%).
| Demographics | Rating | Rank | Female Unemployment |
| Vietnamese | 0.0 /100 | #322 | Tragic 6.5% |
| Immigrants | Belize | 0.0 /100 | #323 | Tragic 6.5% |
| Cheyenne | 0.0 /100 | #324 | Tragic 6.6% |
| Apache | 0.0 /100 | #325 | Tragic 6.6% |
| Natives/Alaskans | 0.0 /100 | #326 | Tragic 6.6% |
| Alaska Natives | 0.0 /100 | #327 | Tragic 6.6% |
| Guyanese | 0.0 /100 | #328 | Tragic 6.7% |
| Immigrants | Guyana | 0.0 /100 | #329 | Tragic 6.7% |
| Yakama | 0.0 /100 | #330 | Tragic 6.7% |
| Paiute | 0.0 /100 | #331 | Tragic 6.8% |
| Sioux | 0.0 /100 | #332 | Tragic 7.0% |
| Menominee | 0.0 /100 | #333 | Tragic 7.0% |
| Immigrants | Armenia | 0.0 /100 | #334 | Tragic 7.1% |
| Dominicans | 0.0 /100 | #335 | Tragic 7.2% |
| Immigrants | Dominican Republic | 0.0 /100 | #336 | Tragic 7.2% |
Demographics Similar to Immigrants from Liberia by Female Unemployment
In terms of female unemployment, the demographic groups most similar to Immigrants from Liberia are Guamanian/Chamorro (5.6%, a difference of 0.14%), Japanese (5.6%, a difference of 0.37%), Immigrants from Western Asia (5.6%, a difference of 0.45%), Marshallese (5.6%, a difference of 0.55%), and Spanish American (5.6%, a difference of 0.55%).
| Demographics | Rating | Rank | Female Unemployment |
| Immigrants | Panama | 3.2 /100 | #237 | Tragic 5.5% |
| Sierra Leoneans | 3.2 /100 | #238 | Tragic 5.5% |
| Aleuts | 3.0 /100 | #239 | Tragic 5.5% |
| Immigrants | South America | 2.9 /100 | #240 | Tragic 5.5% |
| South American Indians | 2.8 /100 | #241 | Tragic 5.5% |
| Marshallese | 2.3 /100 | #242 | Tragic 5.6% |
| Spanish Americans | 2.2 /100 | #243 | Tragic 5.6% |
| Immigrants | Liberia | 1.5 /100 | #244 | Tragic 5.6% |
| Guamanians/Chamorros | 1.4 /100 | #245 | Tragic 5.6% |
| Japanese | 1.2 /100 | #246 | Tragic 5.6% |
| Immigrants | Western Asia | 1.1 /100 | #247 | Tragic 5.6% |
| Cree | 1.0 /100 | #248 | Tragic 5.6% |
| Immigrants | Uzbekistan | 1.0 /100 | #249 | Tragic 5.6% |
| Immigrants | Syria | 0.8 /100 | #250 | Tragic 5.6% |
| Assyrians/Chaldeans/Syriacs | 0.8 /100 | #251 | Tragic 5.6% |