Immigrants from Guyana vs Paraguayan Female Unemployment
COMPARE
Immigrants from Guyana
Paraguayan
Female Unemployment
Female Unemployment Comparison
Immigrants from Guyana
Paraguayans
6.7%
FEMALE UNEMPLOYMENT
0.0/ 100
METRIC RATING
329th/ 347
METRIC RANK
5.1%
FEMALE UNEMPLOYMENT
93.2/ 100
METRIC RATING
106th/ 347
METRIC RANK
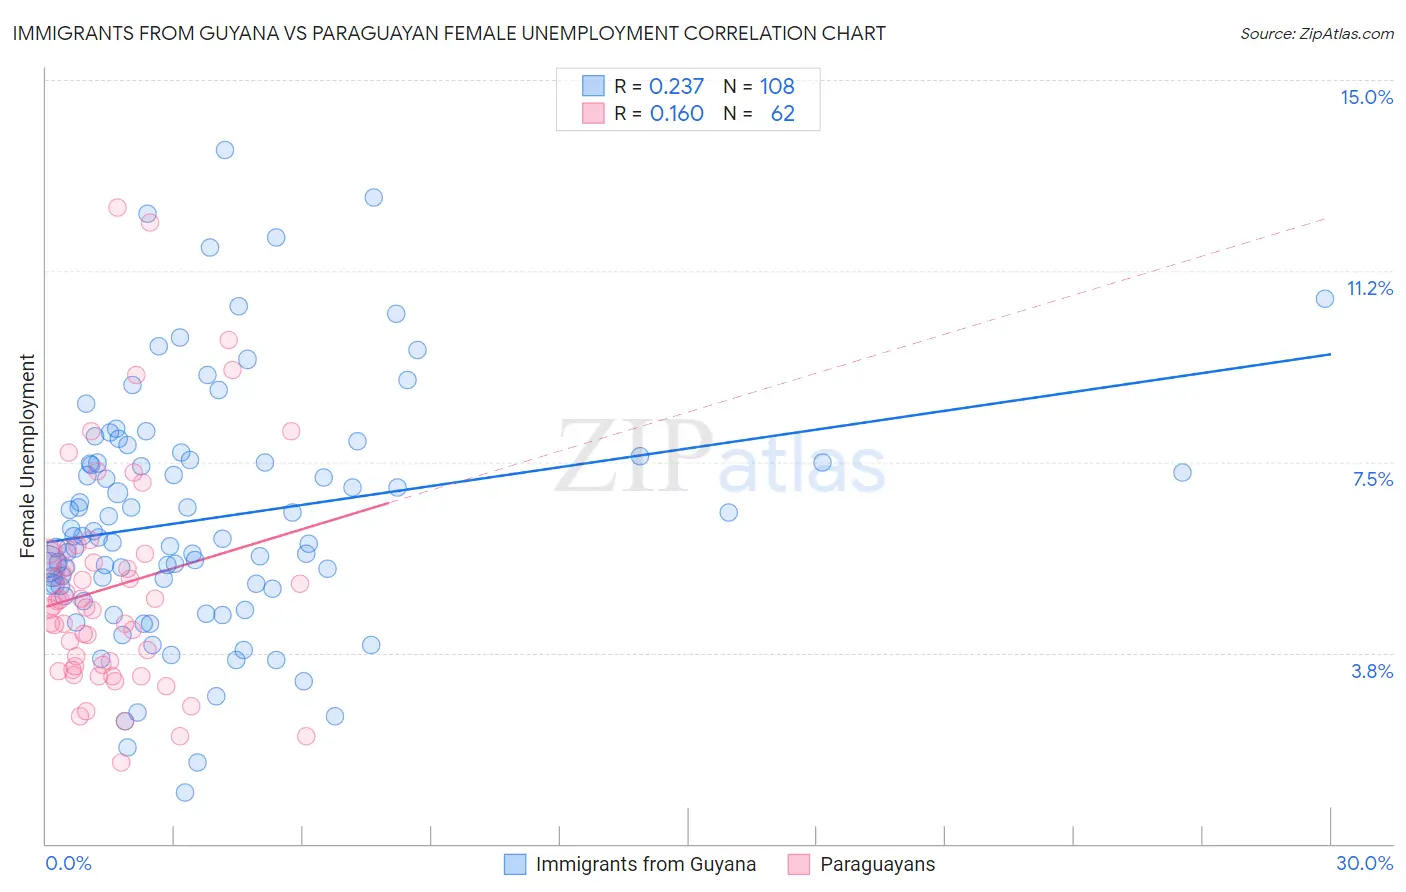
Immigrants from Guyana vs Paraguayan Female Unemployment Correlation Chart
The statistical analysis conducted on geographies consisting of 183,445,412 people shows a weak positive correlation between the proportion of Immigrants from Guyana and unemploymnet rate among females in the United States with a correlation coefficient (R) of 0.237 and weighted average of 6.7%. Similarly, the statistical analysis conducted on geographies consisting of 95,037,971 people shows a poor positive correlation between the proportion of Paraguayans and unemploymnet rate among females in the United States with a correlation coefficient (R) of 0.160 and weighted average of 5.1%, a difference of 32.4%.
Female Unemployment Correlation Summary
| Measurement | Immigrants from Guyana | Paraguayan |
| Minimum | 1.0% | 1.6% |
| Maximum | 13.6% | 12.5% |
| Range | 12.6% | 10.9% |
| Mean | 6.4% | 5.0% |
| Median | 6.0% | 4.7% |
| Interquartile 25% (IQ1) | 5.1% | 3.5% |
| Interquartile 75% (IQ3) | 7.5% | 5.7% |
| Interquartile Range (IQR) | 2.4% | 2.2% |
| Standard Deviation (Sample) | 2.4% | 2.2% |
| Standard Deviation (Population) | 2.4% | 2.2% |
Similar Demographics by Female Unemployment
Demographics Similar to Immigrants from Guyana by Female Unemployment
In terms of female unemployment, the demographic groups most similar to Immigrants from Guyana are Guyanese (6.7%, a difference of 0.37%), Yakama (6.7%, a difference of 0.57%), Alaska Native (6.6%, a difference of 0.80%), Native/Alaskan (6.6%, a difference of 0.89%), and Apache (6.6%, a difference of 1.5%).
| Demographics | Rating | Rank | Female Unemployment |
| Vietnamese | 0.0 /100 | #322 | Tragic 6.5% |
| Immigrants | Belize | 0.0 /100 | #323 | Tragic 6.5% |
| Cheyenne | 0.0 /100 | #324 | Tragic 6.6% |
| Apache | 0.0 /100 | #325 | Tragic 6.6% |
| Natives/Alaskans | 0.0 /100 | #326 | Tragic 6.6% |
| Alaska Natives | 0.0 /100 | #327 | Tragic 6.6% |
| Guyanese | 0.0 /100 | #328 | Tragic 6.7% |
| Immigrants | Guyana | 0.0 /100 | #329 | Tragic 6.7% |
| Yakama | 0.0 /100 | #330 | Tragic 6.7% |
| Paiute | 0.0 /100 | #331 | Tragic 6.8% |
| Sioux | 0.0 /100 | #332 | Tragic 7.0% |
| Menominee | 0.0 /100 | #333 | Tragic 7.0% |
| Immigrants | Armenia | 0.0 /100 | #334 | Tragic 7.1% |
| Dominicans | 0.0 /100 | #335 | Tragic 7.2% |
| Immigrants | Dominican Republic | 0.0 /100 | #336 | Tragic 7.2% |
Demographics Similar to Paraguayans by Female Unemployment
In terms of female unemployment, the demographic groups most similar to Paraguayans are Immigrants from Switzerland (5.1%, a difference of 0.030%), Puget Sound Salish (5.1%, a difference of 0.050%), Immigrants from England (5.0%, a difference of 0.090%), Immigrants from Eastern Africa (5.1%, a difference of 0.090%), and Kenyan (5.0%, a difference of 0.12%).
| Demographics | Rating | Rank | Female Unemployment |
| Immigrants | Zaire | 95.2 /100 | #99 | Exceptional 5.0% |
| Indonesians | 95.1 /100 | #100 | Exceptional 5.0% |
| Immigrants | Czechoslovakia | 95.0 /100 | #101 | Exceptional 5.0% |
| Immigrants | Kenya | 94.8 /100 | #102 | Exceptional 5.0% |
| Somalis | 94.6 /100 | #103 | Exceptional 5.0% |
| Kenyans | 93.7 /100 | #104 | Exceptional 5.0% |
| Immigrants | England | 93.6 /100 | #105 | Exceptional 5.0% |
| Paraguayans | 93.2 /100 | #106 | Exceptional 5.1% |
| Immigrants | Switzerland | 93.1 /100 | #107 | Exceptional 5.1% |
| Puget Sound Salish | 93.0 /100 | #108 | Exceptional 5.1% |
| Immigrants | Eastern Africa | 92.8 /100 | #109 | Exceptional 5.1% |
| Macedonians | 92.4 /100 | #110 | Exceptional 5.1% |
| Immigrants | Burma/Myanmar | 92.3 /100 | #111 | Exceptional 5.1% |
| Estonians | 92.1 /100 | #112 | Exceptional 5.1% |
| Immigrants | Saudi Arabia | 91.2 /100 | #113 | Exceptional 5.1% |