Albanian vs Uruguayan Female Unemployment
COMPARE
Albanian
Uruguayan
Female Unemployment
Female Unemployment Comparison
Albanians
Uruguayans
5.2%
FEMALE UNEMPLOYMENT
68.3/ 100
METRIC RATING
158th/ 347
METRIC RANK
5.4%
FEMALE UNEMPLOYMENT
11.4/ 100
METRIC RATING
212th/ 347
METRIC RANK
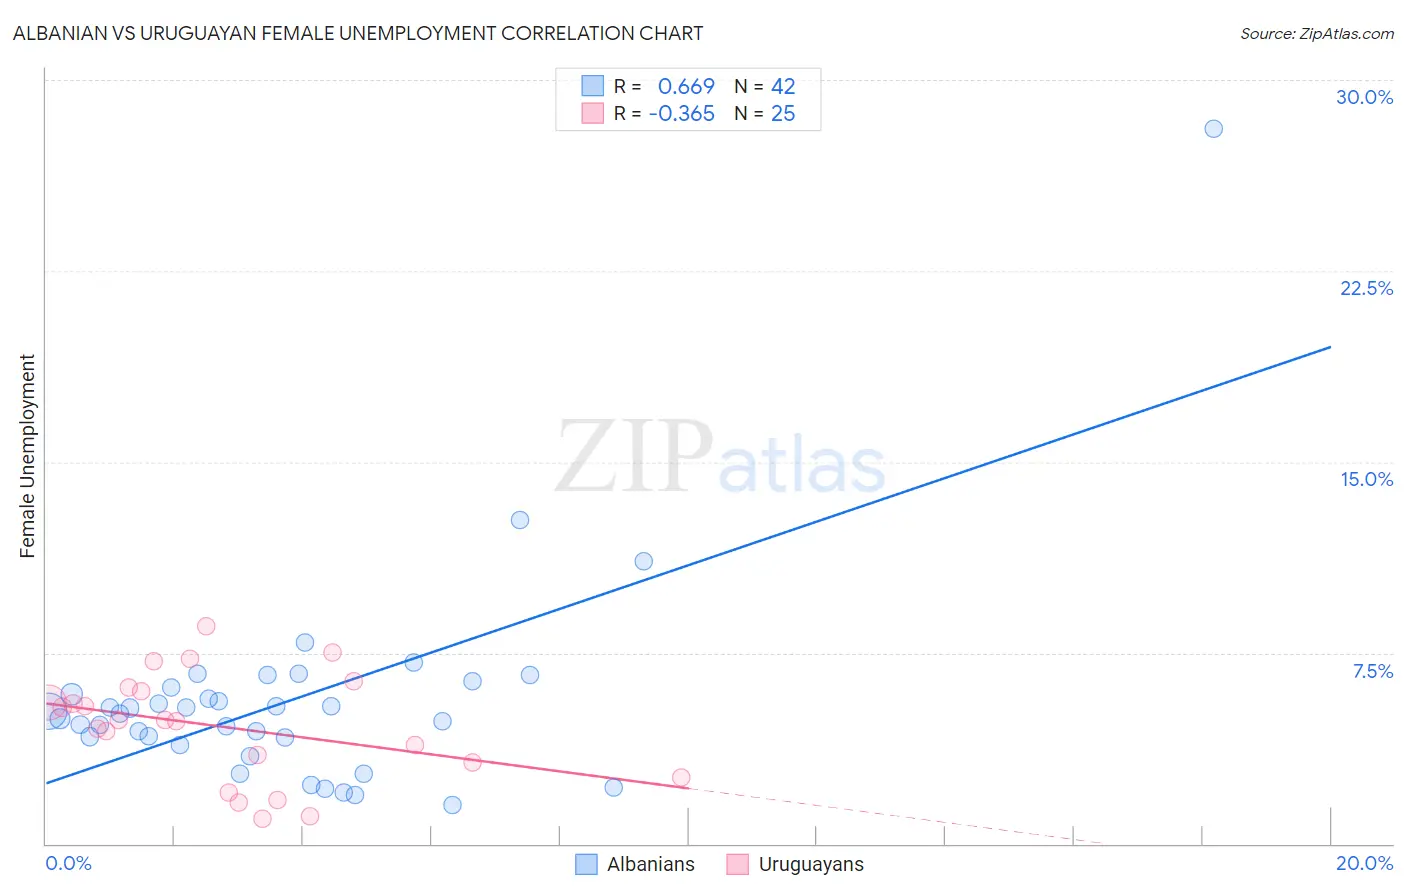
Albanian vs Uruguayan Female Unemployment Correlation Chart
The statistical analysis conducted on geographies consisting of 192,822,109 people shows a significant positive correlation between the proportion of Albanians and unemploymnet rate among females in the United States with a correlation coefficient (R) of 0.669 and weighted average of 5.2%. Similarly, the statistical analysis conducted on geographies consisting of 144,657,332 people shows a mild negative correlation between the proportion of Uruguayans and unemploymnet rate among females in the United States with a correlation coefficient (R) of -0.365 and weighted average of 5.4%, a difference of 4.3%.
Female Unemployment Correlation Summary
| Measurement | Albanian | Uruguayan |
| Minimum | 1.5% | 1.0% |
| Maximum | 28.1% | 8.5% |
| Range | 26.6% | 7.5% |
| Mean | 5.6% | 4.6% |
| Median | 5.2% | 4.9% |
| Interquartile 25% (IQ1) | 4.2% | 2.9% |
| Interquartile 75% (IQ3) | 6.1% | 6.1% |
| Interquartile Range (IQR) | 1.9% | 3.2% |
| Standard Deviation (Sample) | 4.2% | 2.1% |
| Standard Deviation (Population) | 4.1% | 2.0% |
Similar Demographics by Female Unemployment
Demographics Similar to Albanians by Female Unemployment
In terms of female unemployment, the demographic groups most similar to Albanians are Immigrants from Russia (5.2%, a difference of 0.070%), Immigrants from Northern Africa (5.2%, a difference of 0.10%), Immigrants from Micronesia (5.2%, a difference of 0.10%), Immigrants from Spain (5.2%, a difference of 0.11%), and Immigrants from Pakistan (5.2%, a difference of 0.11%).
| Demographics | Rating | Rank | Female Unemployment |
| Immigrants | China | 75.9 /100 | #151 | Good 5.2% |
| Immigrants | Italy | 75.0 /100 | #152 | Good 5.2% |
| Immigrants | Greece | 74.9 /100 | #153 | Good 5.2% |
| South Africans | 70.8 /100 | #154 | Good 5.2% |
| Immigrants | Egypt | 70.0 /100 | #155 | Good 5.2% |
| Immigrants | Northern Africa | 69.6 /100 | #156 | Good 5.2% |
| Immigrants | Russia | 69.3 /100 | #157 | Good 5.2% |
| Albanians | 68.3 /100 | #158 | Good 5.2% |
| Immigrants | Micronesia | 66.9 /100 | #159 | Good 5.2% |
| Immigrants | Spain | 66.8 /100 | #160 | Good 5.2% |
| Immigrants | Pakistan | 66.7 /100 | #161 | Good 5.2% |
| Potawatomi | 65.9 /100 | #162 | Good 5.2% |
| Immigrants | Asia | 64.3 /100 | #163 | Good 5.2% |
| Bangladeshis | 64.3 /100 | #164 | Good 5.2% |
| Syrians | 62.8 /100 | #165 | Good 5.2% |
Demographics Similar to Uruguayans by Female Unemployment
In terms of female unemployment, the demographic groups most similar to Uruguayans are Ottawa (5.4%, a difference of 0.020%), Choctaw (5.4%, a difference of 0.12%), Samoan (5.4%, a difference of 0.12%), Seminole (5.4%, a difference of 0.17%), and Immigrants from Nicaragua (5.4%, a difference of 0.19%).
| Demographics | Rating | Rank | Female Unemployment |
| Immigrants | Afghanistan | 18.9 /100 | #205 | Poor 5.4% |
| Immigrants | Brazil | 18.8 /100 | #206 | Poor 5.4% |
| Creek | 15.4 /100 | #207 | Poor 5.4% |
| Immigrants | Costa Rica | 13.7 /100 | #208 | Poor 5.4% |
| Koreans | 13.4 /100 | #209 | Poor 5.4% |
| Choctaw | 12.3 /100 | #210 | Poor 5.4% |
| Ottawa | 11.6 /100 | #211 | Poor 5.4% |
| Uruguayans | 11.4 /100 | #212 | Poor 5.4% |
| Samoans | 10.6 /100 | #213 | Poor 5.4% |
| Seminole | 10.3 /100 | #214 | Poor 5.4% |
| Immigrants | Nicaragua | 10.2 /100 | #215 | Poor 5.4% |
| Comanche | 10.0 /100 | #216 | Poor 5.4% |
| Peruvians | 9.6 /100 | #217 | Tragic 5.4% |
| Bermudans | 9.0 /100 | #218 | Tragic 5.4% |
| South Americans | 8.6 /100 | #219 | Tragic 5.4% |