Immigrants from Guatemala vs Kiowa Unemployment
COMPARE
Immigrants from Guatemala
Kiowa
Unemployment
Unemployment Comparison
Immigrants from Guatemala
Kiowa
5.8%
UNEMPLOYMENT
0.1/ 100
METRIC RATING
261st/ 347
METRIC RANK
5.7%
UNEMPLOYMENT
0.6/ 100
METRIC RATING
251st/ 347
METRIC RANK
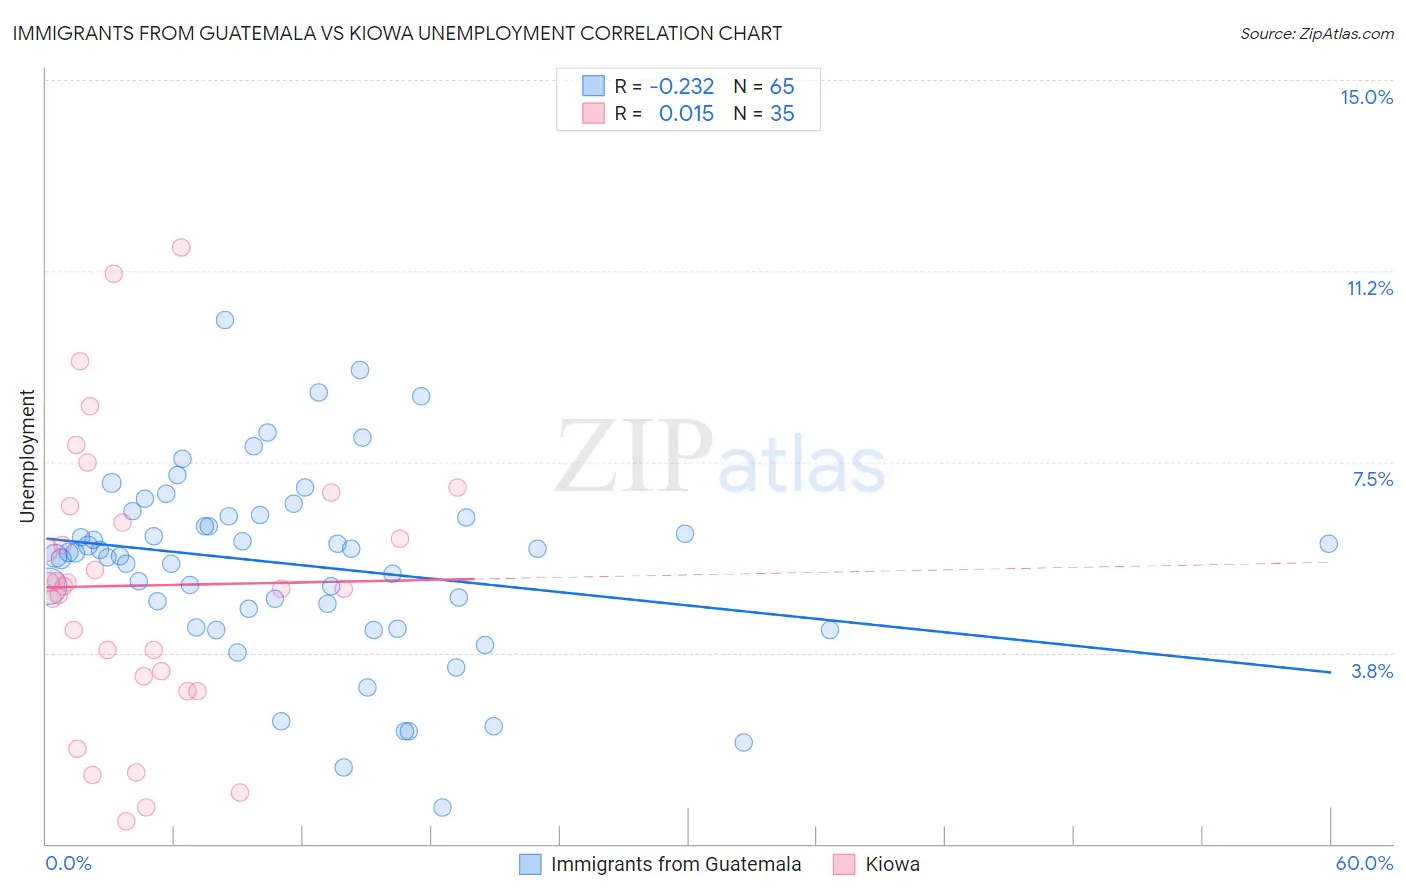
Immigrants from Guatemala vs Kiowa Unemployment Correlation Chart
The statistical analysis conducted on geographies consisting of 376,960,601 people shows a weak negative correlation between the proportion of Immigrants from Guatemala and unemployment in the United States with a correlation coefficient (R) of -0.232 and weighted average of 5.8%. Similarly, the statistical analysis conducted on geographies consisting of 56,085,771 people shows no correlation between the proportion of Kiowa and unemployment in the United States with a correlation coefficient (R) of 0.015 and weighted average of 5.7%, a difference of 2.1%.
Unemployment Correlation Summary
| Measurement | Immigrants from Guatemala | Kiowa |
| Minimum | 0.70% | 0.44% |
| Maximum | 10.3% | 11.7% |
| Range | 9.6% | 11.3% |
| Mean | 5.5% | 5.1% |
| Median | 5.7% | 5.1% |
| Interquartile 25% (IQ1) | 4.4% | 3.3% |
| Interquartile 75% (IQ3) | 6.4% | 6.6% |
| Interquartile Range (IQR) | 2.0% | 3.3% |
| Standard Deviation (Sample) | 1.9% | 2.7% |
| Standard Deviation (Population) | 1.8% | 2.7% |
Demographics Similar to Immigrants from Guatemala and Kiowa by Unemployment
In terms of unemployment, the demographic groups most similar to Immigrants from Guatemala are Immigrants from Uzbekistan (5.8%, a difference of 0.020%), Subsaharan African (5.8%, a difference of 0.040%), Sierra Leonean (5.8%, a difference of 0.10%), Salvadoran (5.8%, a difference of 0.13%), and Immigrants from Bahamas (5.8%, a difference of 0.16%). Similarly, the demographic groups most similar to Kiowa are Japanese (5.6%, a difference of 0.47%), Cajun (5.6%, a difference of 0.48%), Liberian (5.6%, a difference of 0.74%), Honduran (5.7%, a difference of 0.74%), and Central American (5.7%, a difference of 0.75%).
| Demographics | Rating | Rank | Unemployment |
| Bermudans | 1.1 /100 | #246 | Tragic 5.6% |
| Immigrants | Cameroon | 1.0 /100 | #247 | Tragic 5.6% |
| Liberians | 0.9 /100 | #248 | Tragic 5.6% |
| Cajuns | 0.8 /100 | #249 | Tragic 5.6% |
| Japanese | 0.8 /100 | #250 | Tragic 5.6% |
| Kiowa | 0.6 /100 | #251 | Tragic 5.7% |
| Hondurans | 0.3 /100 | #252 | Tragic 5.7% |
| Central Americans | 0.3 /100 | #253 | Tragic 5.7% |
| Immigrants | Honduras | 0.3 /100 | #254 | Tragic 5.7% |
| Immigrants | Portugal | 0.2 /100 | #255 | Tragic 5.7% |
| Guatemalans | 0.2 /100 | #256 | Tragic 5.8% |
| Yaqui | 0.2 /100 | #257 | Tragic 5.8% |
| Immigrants | Bahamas | 0.1 /100 | #258 | Tragic 5.8% |
| Sub-Saharan Africans | 0.1 /100 | #259 | Tragic 5.8% |
| Immigrants | Uzbekistan | 0.1 /100 | #260 | Tragic 5.8% |
| Immigrants | Guatemala | 0.1 /100 | #261 | Tragic 5.8% |
| Sierra Leoneans | 0.1 /100 | #262 | Tragic 5.8% |
| Salvadorans | 0.1 /100 | #263 | Tragic 5.8% |
| Immigrants | Liberia | 0.1 /100 | #264 | Tragic 5.8% |
| Nigerians | 0.1 /100 | #265 | Tragic 5.8% |
| Mexican American Indians | 0.1 /100 | #266 | Tragic 5.8% |