Immigrants from England vs Immigrants from Philippines Male Unemployment
COMPARE
Immigrants from England
Immigrants from Philippines
Male Unemployment
Male Unemployment Comparison
Immigrants from England
Immigrants from Philippines
5.1%
MALE UNEMPLOYMENT
90.8/ 100
METRIC RATING
110th/ 347
METRIC RANK
5.4%
MALE UNEMPLOYMENT
13.5/ 100
METRIC RATING
201st/ 347
METRIC RANK
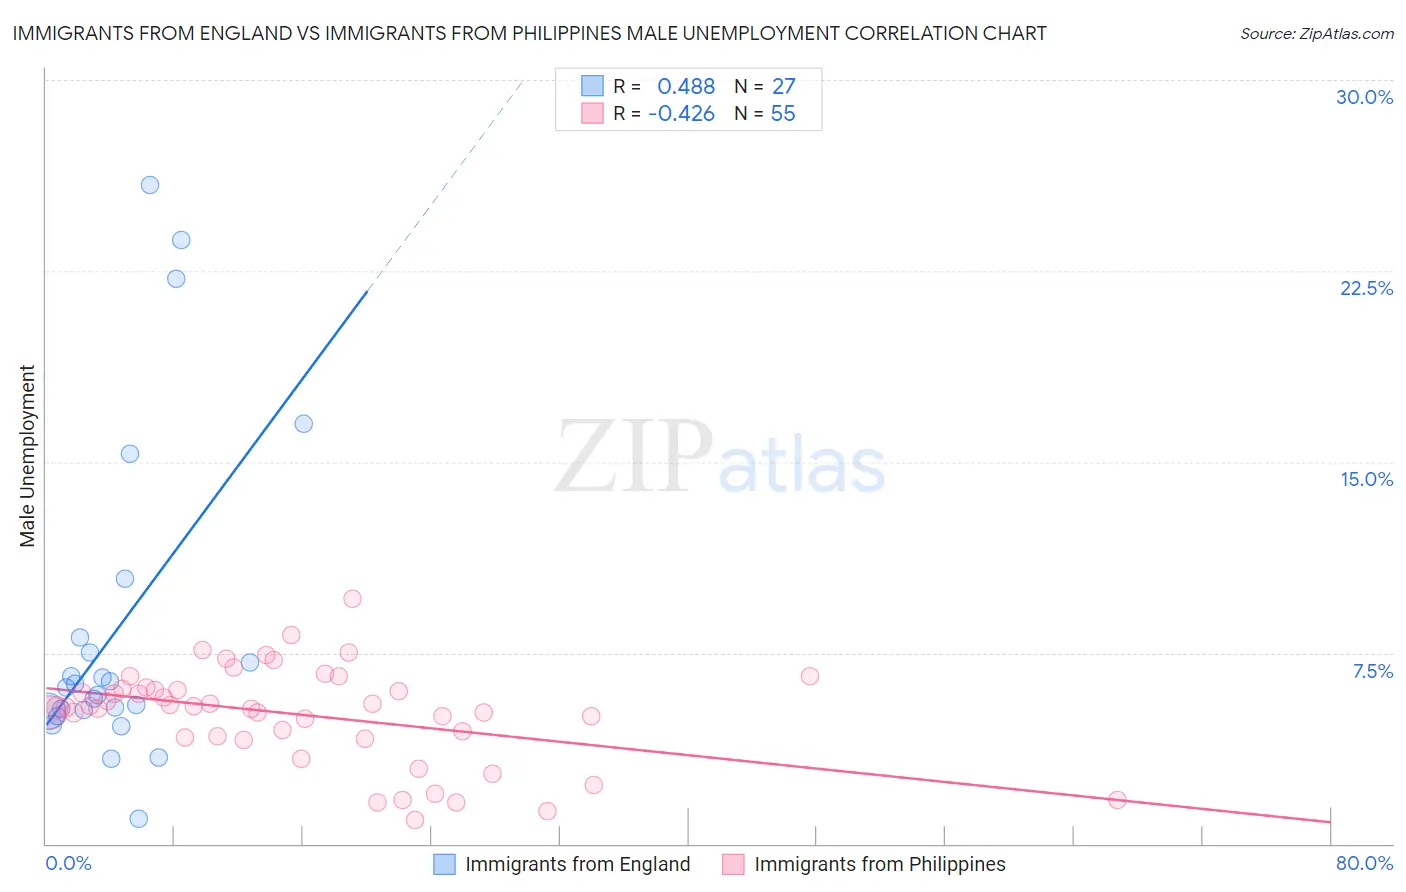
Immigrants from England vs Immigrants from Philippines Male Unemployment Correlation Chart
The statistical analysis conducted on geographies consisting of 390,096,041 people shows a moderate positive correlation between the proportion of Immigrants from England and unemployment rate among males in the United States with a correlation coefficient (R) of 0.488 and weighted average of 5.1%. Similarly, the statistical analysis conducted on geographies consisting of 468,596,641 people shows a moderate negative correlation between the proportion of Immigrants from Philippines and unemployment rate among males in the United States with a correlation coefficient (R) of -0.426 and weighted average of 5.4%, a difference of 6.3%.
Male Unemployment Correlation Summary
| Measurement | Immigrants from England | Immigrants from Philippines |
| Minimum | 1.0% | 0.95% |
| Maximum | 25.9% | 9.6% |
| Range | 24.9% | 8.6% |
| Mean | 8.5% | 5.1% |
| Median | 6.1% | 5.3% |
| Interquartile 25% (IQ1) | 5.2% | 4.2% |
| Interquartile 75% (IQ3) | 8.1% | 6.1% |
| Interquartile Range (IQR) | 2.9% | 1.9% |
| Standard Deviation (Sample) | 6.4% | 1.9% |
| Standard Deviation (Population) | 6.3% | 1.9% |
Similar Demographics by Male Unemployment
Demographics Similar to Immigrants from England by Male Unemployment
In terms of male unemployment, the demographic groups most similar to Immigrants from England are Immigrants from Eastern Asia (5.1%, a difference of 0.010%), Immigrants from Pakistan (5.1%, a difference of 0.020%), Immigrants from Nicaragua (5.1%, a difference of 0.080%), Ethiopian (5.1%, a difference of 0.090%), and Immigrants from Moldova (5.1%, a difference of 0.090%).
| Demographics | Rating | Rank | Male Unemployment |
| Immigrants | Jordan | 91.9 /100 | #103 | Exceptional 5.1% |
| Immigrants | Chile | 91.8 /100 | #104 | Exceptional 5.1% |
| Immigrants | Czechoslovakia | 91.7 /100 | #105 | Exceptional 5.1% |
| Immigrants | Ethiopia | 91.5 /100 | #106 | Exceptional 5.1% |
| Ethiopians | 91.3 /100 | #107 | Exceptional 5.1% |
| Immigrants | Nicaragua | 91.2 /100 | #108 | Exceptional 5.1% |
| Immigrants | Pakistan | 90.9 /100 | #109 | Exceptional 5.1% |
| Immigrants | England | 90.8 /100 | #110 | Exceptional 5.1% |
| Immigrants | Eastern Asia | 90.8 /100 | #111 | Exceptional 5.1% |
| Immigrants | Moldova | 90.3 /100 | #112 | Exceptional 5.1% |
| Immigrants | Austria | 90.3 /100 | #113 | Exceptional 5.1% |
| Romanians | 89.8 /100 | #114 | Excellent 5.1% |
| Immigrants | Asia | 89.6 /100 | #115 | Excellent 5.1% |
| Immigrants | Denmark | 89.4 /100 | #116 | Excellent 5.1% |
| Estonians | 89.0 /100 | #117 | Excellent 5.1% |
Demographics Similar to Immigrants from Philippines by Male Unemployment
In terms of male unemployment, the demographic groups most similar to Immigrants from Philippines are Immigrants from Zaire (5.4%, a difference of 0.020%), Nonimmigrants (5.4%, a difference of 0.040%), Immigrants from Laos (5.4%, a difference of 0.050%), Immigrants from Greece (5.4%, a difference of 0.12%), and Immigrants from Thailand (5.4%, a difference of 0.15%).
| Demographics | Rating | Rank | Male Unemployment |
| Spanish | 19.7 /100 | #194 | Poor 5.4% |
| Immigrants | Southern Europe | 17.7 /100 | #195 | Poor 5.4% |
| Albanians | 17.3 /100 | #196 | Poor 5.4% |
| Alsatians | 16.7 /100 | #197 | Poor 5.4% |
| Immigrants | Thailand | 14.7 /100 | #198 | Poor 5.4% |
| Immigrants | Greece | 14.5 /100 | #199 | Poor 5.4% |
| Immigrants | Zaire | 13.7 /100 | #200 | Poor 5.4% |
| Immigrants | Philippines | 13.5 /100 | #201 | Poor 5.4% |
| Immigrants | Nonimmigrants | 13.1 /100 | #202 | Poor 5.4% |
| Immigrants | Laos | 13.0 /100 | #203 | Poor 5.4% |
| Guamanians/Chamorros | 12.3 /100 | #204 | Poor 5.4% |
| Immigrants | Costa Rica | 11.4 /100 | #205 | Poor 5.5% |
| Immigrants | Ukraine | 9.9 /100 | #206 | Tragic 5.5% |
| Immigrants | Syria | 9.3 /100 | #207 | Tragic 5.5% |
| Immigrants | Lebanon | 8.6 /100 | #208 | Tragic 5.5% |