Filipino vs Slavic Male Unemployment
COMPARE
Filipino
Slavic
Male Unemployment
Male Unemployment Comparison
Filipinos
Slavs
4.7%
MALE UNEMPLOYMENT
99.9/ 100
METRIC RATING
17th/ 347
METRIC RANK
5.1%
MALE UNEMPLOYMENT
94.2/ 100
METRIC RATING
92nd/ 347
METRIC RANK
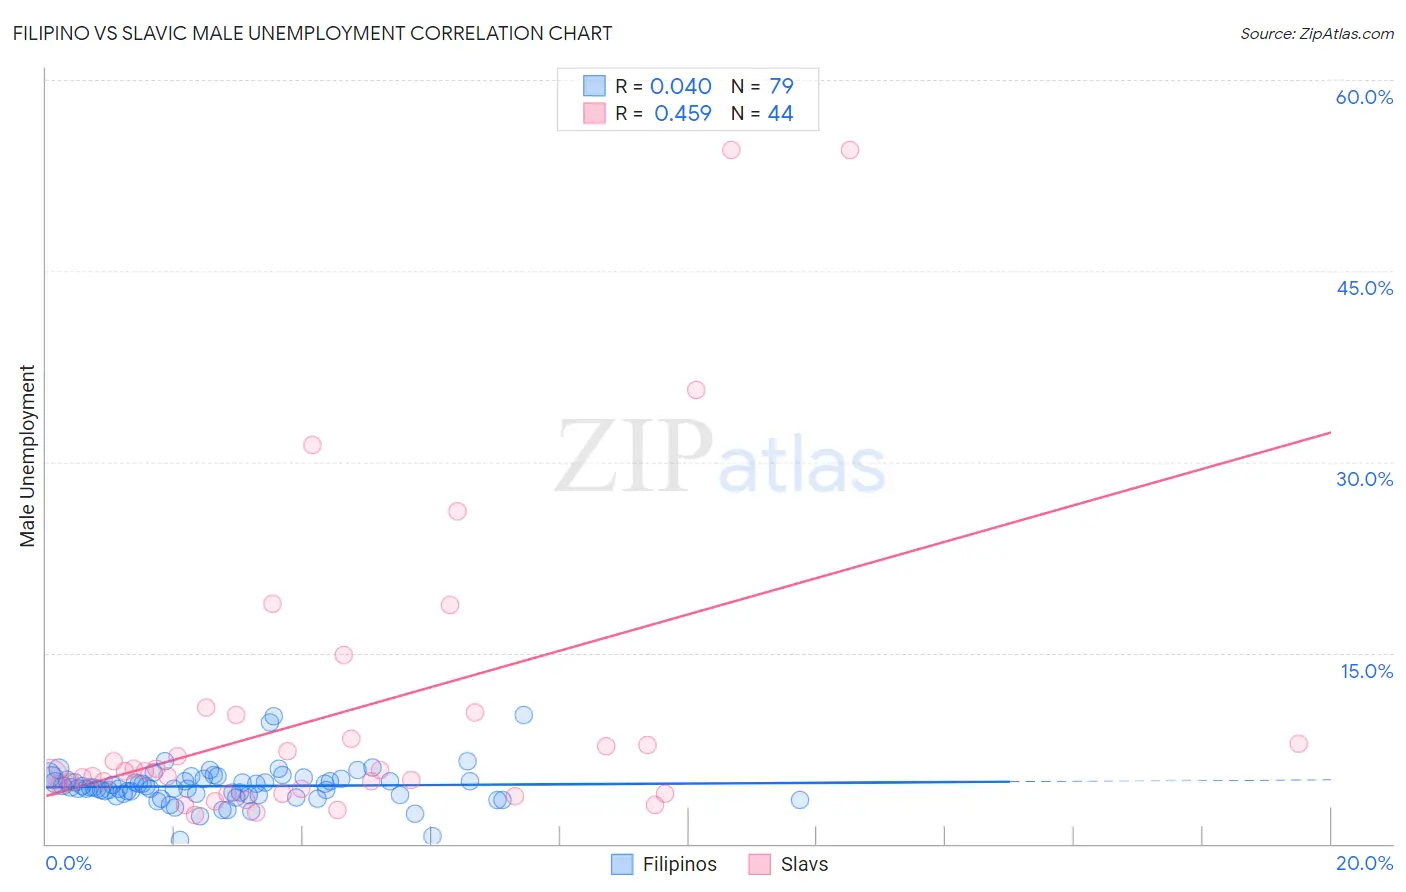
Filipino vs Slavic Male Unemployment Correlation Chart
The statistical analysis conducted on geographies consisting of 253,897,394 people shows no correlation between the proportion of Filipinos and unemployment rate among males in the United States with a correlation coefficient (R) of 0.040 and weighted average of 4.7%. Similarly, the statistical analysis conducted on geographies consisting of 270,129,729 people shows a moderate positive correlation between the proportion of Slavs and unemployment rate among males in the United States with a correlation coefficient (R) of 0.459 and weighted average of 5.1%, a difference of 7.1%.
Male Unemployment Correlation Summary
| Measurement | Filipino | Slavic |
| Minimum | 0.30% | 2.2% |
| Maximum | 10.1% | 54.5% |
| Range | 9.8% | 52.3% |
| Mean | 4.5% | 10.3% |
| Median | 4.4% | 5.7% |
| Interquartile 25% (IQ1) | 3.8% | 4.1% |
| Interquartile 75% (IQ3) | 5.1% | 9.1% |
| Interquartile Range (IQR) | 1.3% | 5.0% |
| Standard Deviation (Sample) | 1.5% | 12.2% |
| Standard Deviation (Population) | 1.5% | 12.1% |
Similar Demographics by Male Unemployment
Demographics Similar to Filipinos by Male Unemployment
In terms of male unemployment, the demographic groups most similar to Filipinos are English (4.8%, a difference of 0.30%), European (4.8%, a difference of 0.32%), Pennsylvania German (4.8%, a difference of 0.38%), Immigrants from Taiwan (4.8%, a difference of 0.54%), and Carpatho Rusyn (4.8%, a difference of 0.55%).
| Demographics | Rating | Rank | Male Unemployment |
| Cubans | 100.0 /100 | #10 | Exceptional 4.6% |
| Swedes | 100.0 /100 | #11 | Exceptional 4.6% |
| Immigrants | Bolivia | 100.0 /100 | #12 | Exceptional 4.7% |
| Bolivians | 100.0 /100 | #13 | Exceptional 4.7% |
| Germans | 100.0 /100 | #14 | Exceptional 4.7% |
| Scandinavians | 100.0 /100 | #15 | Exceptional 4.7% |
| Swiss | 99.9 /100 | #16 | Exceptional 4.7% |
| Filipinos | 99.9 /100 | #17 | Exceptional 4.7% |
| English | 99.9 /100 | #18 | Exceptional 4.8% |
| Europeans | 99.9 /100 | #19 | Exceptional 4.8% |
| Pennsylvania Germans | 99.9 /100 | #20 | Exceptional 4.8% |
| Immigrants | Taiwan | 99.9 /100 | #21 | Exceptional 4.8% |
| Carpatho Rusyns | 99.9 /100 | #22 | Exceptional 4.8% |
| Tongans | 99.9 /100 | #23 | Exceptional 4.8% |
| Immigrants | South Central Asia | 99.9 /100 | #24 | Exceptional 4.8% |
Demographics Similar to Slavs by Male Unemployment
In terms of male unemployment, the demographic groups most similar to Slavs are Immigrants from Serbia (5.1%, a difference of 0.0%), Canadian (5.1%, a difference of 0.050%), Immigrants from Turkey (5.1%, a difference of 0.060%), Italian (5.1%, a difference of 0.12%), and Immigrants from Australia (5.1%, a difference of 0.14%).
| Demographics | Rating | Rank | Male Unemployment |
| Immigrants | North Macedonia | 95.6 /100 | #85 | Exceptional 5.1% |
| Maltese | 95.5 /100 | #86 | Exceptional 5.1% |
| Immigrants | Romania | 95.4 /100 | #87 | Exceptional 5.1% |
| Immigrants | Sri Lanka | 94.9 /100 | #88 | Exceptional 5.1% |
| Immigrants | Australia | 94.7 /100 | #89 | Exceptional 5.1% |
| Okinawans | 94.7 /100 | #90 | Exceptional 5.1% |
| Immigrants | Turkey | 94.4 /100 | #91 | Exceptional 5.1% |
| Slavs | 94.2 /100 | #92 | Exceptional 5.1% |
| Immigrants | Serbia | 94.2 /100 | #93 | Exceptional 5.1% |
| Canadians | 94.1 /100 | #94 | Exceptional 5.1% |
| Italians | 93.8 /100 | #95 | Exceptional 5.1% |
| Asians | 93.7 /100 | #96 | Exceptional 5.1% |
| Immigrants | Spain | 93.4 /100 | #97 | Exceptional 5.1% |
| Immigrants | Kuwait | 93.3 /100 | #98 | Exceptional 5.1% |
| Uruguayans | 93.0 /100 | #99 | Exceptional 5.1% |