Immigrants from England vs Native/Alaskan Male Unemployment
COMPARE
Immigrants from England
Native/Alaskan
Male Unemployment
Male Unemployment Comparison
Immigrants from England
Natives/Alaskans
5.1%
MALE UNEMPLOYMENT
90.8/ 100
METRIC RATING
110th/ 347
METRIC RANK
7.7%
MALE UNEMPLOYMENT
0.0/ 100
METRIC RATING
328th/ 347
METRIC RANK
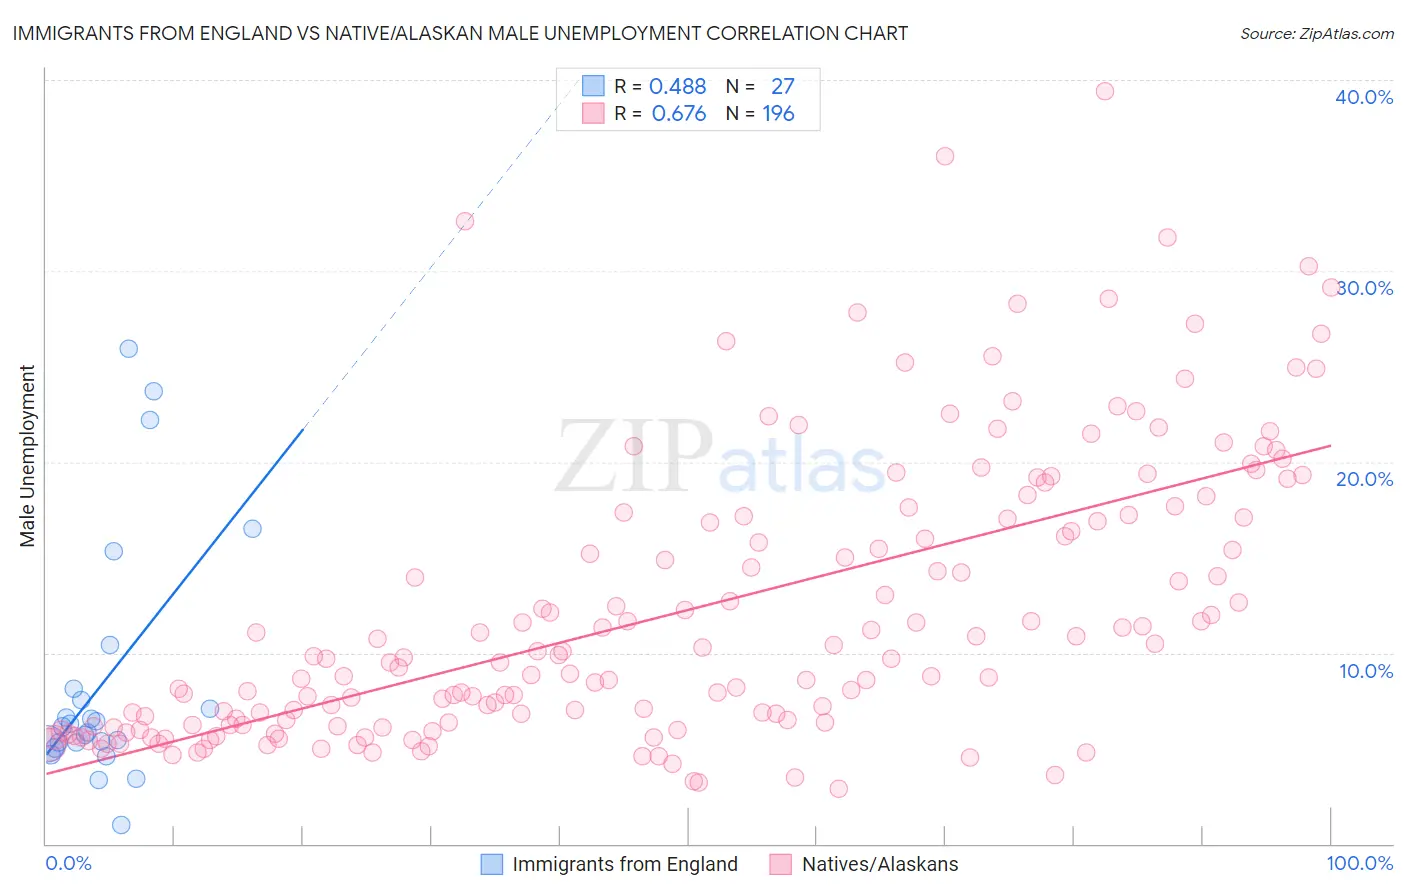
Immigrants from England vs Native/Alaskan Male Unemployment Correlation Chart
The statistical analysis conducted on geographies consisting of 390,096,041 people shows a moderate positive correlation between the proportion of Immigrants from England and unemployment rate among males in the United States with a correlation coefficient (R) of 0.488 and weighted average of 5.1%. Similarly, the statistical analysis conducted on geographies consisting of 507,569,897 people shows a significant positive correlation between the proportion of Natives/Alaskans and unemployment rate among males in the United States with a correlation coefficient (R) of 0.676 and weighted average of 7.7%, a difference of 50.8%.
Male Unemployment Correlation Summary
| Measurement | Immigrants from England | Native/Alaskan |
| Minimum | 1.0% | 2.9% |
| Maximum | 25.9% | 39.4% |
| Range | 24.9% | 36.5% |
| Mean | 8.5% | 12.2% |
| Median | 6.1% | 9.7% |
| Interquartile 25% (IQ1) | 5.2% | 6.2% |
| Interquartile 75% (IQ3) | 8.1% | 17.1% |
| Interquartile Range (IQR) | 2.9% | 10.9% |
| Standard Deviation (Sample) | 6.4% | 7.4% |
| Standard Deviation (Population) | 6.3% | 7.4% |
Similar Demographics by Male Unemployment
Demographics Similar to Immigrants from England by Male Unemployment
In terms of male unemployment, the demographic groups most similar to Immigrants from England are Immigrants from Eastern Asia (5.1%, a difference of 0.010%), Immigrants from Pakistan (5.1%, a difference of 0.020%), Immigrants from Nicaragua (5.1%, a difference of 0.080%), Ethiopian (5.1%, a difference of 0.090%), and Immigrants from Moldova (5.1%, a difference of 0.090%).
| Demographics | Rating | Rank | Male Unemployment |
| Immigrants | Jordan | 91.9 /100 | #103 | Exceptional 5.1% |
| Immigrants | Chile | 91.8 /100 | #104 | Exceptional 5.1% |
| Immigrants | Czechoslovakia | 91.7 /100 | #105 | Exceptional 5.1% |
| Immigrants | Ethiopia | 91.5 /100 | #106 | Exceptional 5.1% |
| Ethiopians | 91.3 /100 | #107 | Exceptional 5.1% |
| Immigrants | Nicaragua | 91.2 /100 | #108 | Exceptional 5.1% |
| Immigrants | Pakistan | 90.9 /100 | #109 | Exceptional 5.1% |
| Immigrants | England | 90.8 /100 | #110 | Exceptional 5.1% |
| Immigrants | Eastern Asia | 90.8 /100 | #111 | Exceptional 5.1% |
| Immigrants | Moldova | 90.3 /100 | #112 | Exceptional 5.1% |
| Immigrants | Austria | 90.3 /100 | #113 | Exceptional 5.1% |
| Romanians | 89.8 /100 | #114 | Excellent 5.1% |
| Immigrants | Asia | 89.6 /100 | #115 | Excellent 5.1% |
| Immigrants | Denmark | 89.4 /100 | #116 | Excellent 5.1% |
| Estonians | 89.0 /100 | #117 | Excellent 5.1% |
Demographics Similar to Natives/Alaskans by Male Unemployment
In terms of male unemployment, the demographic groups most similar to Natives/Alaskans are Paiute (7.7%, a difference of 0.38%), Immigrants from Yemen (7.8%, a difference of 0.90%), Immigrants from Dominican Republic (7.6%, a difference of 1.5%), Shoshone (7.6%, a difference of 1.6%), and Dominican (7.6%, a difference of 2.0%).
| Demographics | Rating | Rank | Male Unemployment |
| Immigrants | St. Vincent and the Grenadines | 0.0 /100 | #321 | Tragic 7.5% |
| Immigrants | Cabo Verde | 0.0 /100 | #322 | Tragic 7.5% |
| Immigrants | Grenada | 0.0 /100 | #323 | Tragic 7.6% |
| Dominicans | 0.0 /100 | #324 | Tragic 7.6% |
| Shoshone | 0.0 /100 | #325 | Tragic 7.6% |
| Immigrants | Dominican Republic | 0.0 /100 | #326 | Tragic 7.6% |
| Paiute | 0.0 /100 | #327 | Tragic 7.7% |
| Natives/Alaskans | 0.0 /100 | #328 | Tragic 7.7% |
| Immigrants | Yemen | 0.0 /100 | #329 | Tragic 7.8% |
| Yakama | 0.0 /100 | #330 | Tragic 7.9% |
| Alaska Natives | 0.0 /100 | #331 | Tragic 8.1% |
| Pima | 0.0 /100 | #332 | Tragic 8.3% |
| Sioux | 0.0 /100 | #333 | Tragic 8.4% |
| Tsimshian | 0.0 /100 | #334 | Tragic 8.5% |
| Pueblo | 0.0 /100 | #335 | Tragic 8.5% |