Immigrants from Egypt vs Cherokee Family Households
COMPARE
Immigrants from Egypt
Cherokee
Family Households
Family Households Comparison
Immigrants from Egypt
Cherokee
65.3%
FAMILY HOUSEHOLDS
99.2/ 100
METRIC RATING
87th/ 347
METRIC RANK
65.0%
FAMILY HOUSEHOLDS
95.3/ 100
METRIC RATING
117th/ 347
METRIC RANK
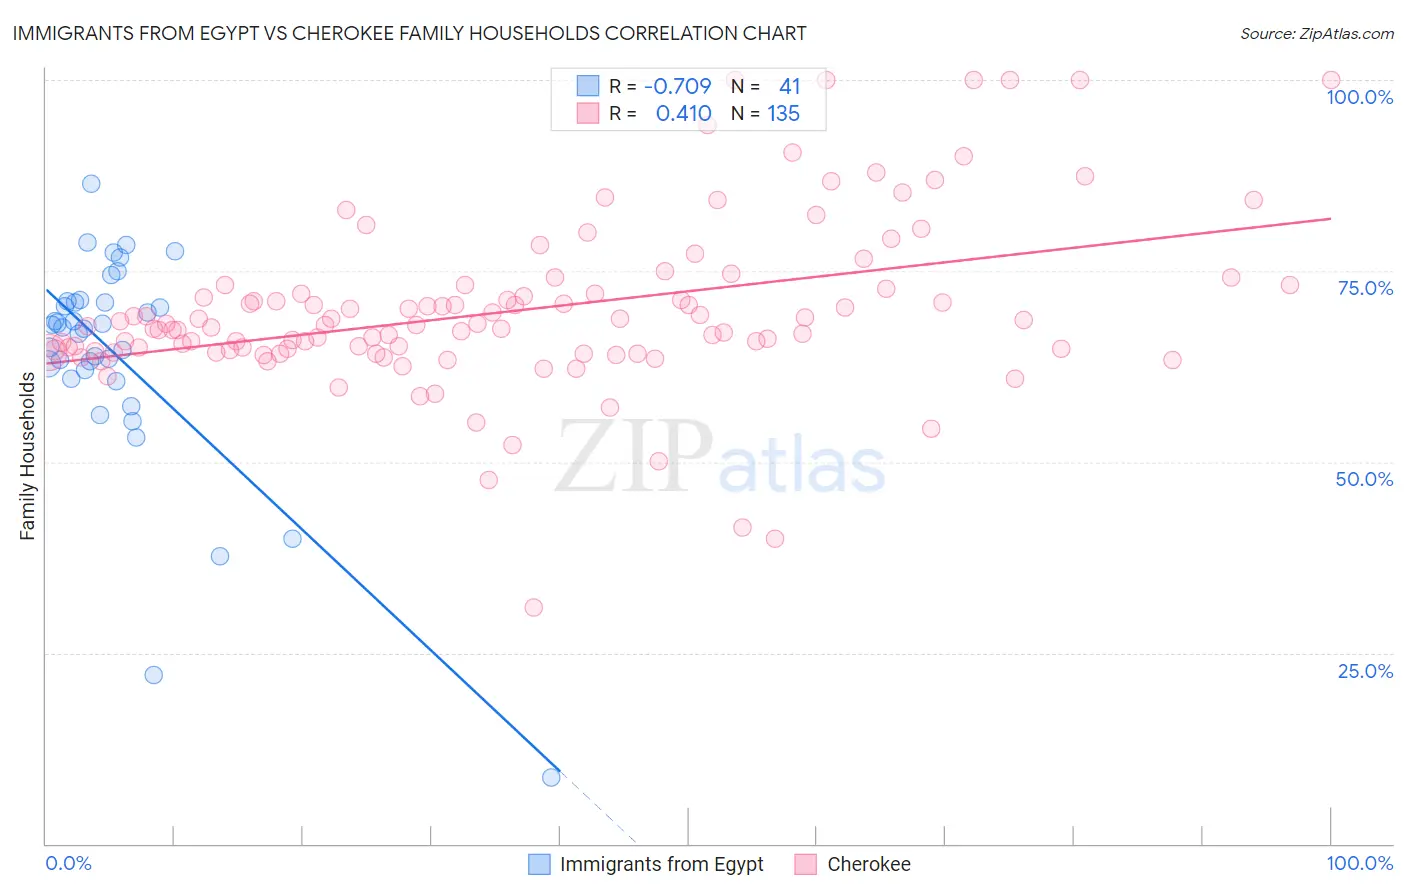
Immigrants from Egypt vs Cherokee Family Households Correlation Chart
The statistical analysis conducted on geographies consisting of 245,430,680 people shows a strong negative correlation between the proportion of Immigrants from Egypt and percentage of family households in the United States with a correlation coefficient (R) of -0.709 and weighted average of 65.3%. Similarly, the statistical analysis conducted on geographies consisting of 493,383,151 people shows a moderate positive correlation between the proportion of Cherokee and percentage of family households in the United States with a correlation coefficient (R) of 0.410 and weighted average of 65.0%, a difference of 0.61%.
Family Households Correlation Summary
| Measurement | Immigrants from Egypt | Cherokee |
| Minimum | 8.7% | 31.0% |
| Maximum | 86.5% | 100.0% |
| Range | 77.8% | 69.0% |
| Mean | 64.0% | 69.9% |
| Median | 67.6% | 67.9% |
| Interquartile 25% (IQ1) | 61.5% | 64.5% |
| Interquartile 75% (IQ3) | 71.0% | 72.7% |
| Interquartile Range (IQR) | 9.5% | 8.2% |
| Standard Deviation (Sample) | 14.6% | 11.2% |
| Standard Deviation (Population) | 14.4% | 11.2% |
Similar Demographics by Family Households
Demographics Similar to Immigrants from Egypt by Family Households
In terms of family households, the demographic groups most similar to Immigrants from Egypt are Immigrants from Haiti (65.3%, a difference of 0.030%), Immigrants from Caribbean (65.3%, a difference of 0.040%), Immigrants from Laos (65.3%, a difference of 0.050%), Egyptian (65.4%, a difference of 0.090%), and Crow (65.3%, a difference of 0.10%).
| Demographics | Rating | Rank | Family Households |
| Puget Sound Salish | 99.8 /100 | #80 | Exceptional 65.6% |
| Jordanians | 99.7 /100 | #81 | Exceptional 65.5% |
| Immigrants | Lebanon | 99.7 /100 | #82 | Exceptional 65.5% |
| Immigrants | Guyana | 99.6 /100 | #83 | Exceptional 65.5% |
| Americans | 99.6 /100 | #84 | Exceptional 65.5% |
| Immigrants | Cambodia | 99.5 /100 | #85 | Exceptional 65.4% |
| Egyptians | 99.4 /100 | #86 | Exceptional 65.4% |
| Immigrants | Egypt | 99.2 /100 | #87 | Exceptional 65.3% |
| Immigrants | Haiti | 99.1 /100 | #88 | Exceptional 65.3% |
| Immigrants | Caribbean | 99.1 /100 | #89 | Exceptional 65.3% |
| Immigrants | Laos | 99.1 /100 | #90 | Exceptional 65.3% |
| Crow | 98.9 /100 | #91 | Exceptional 65.3% |
| Hopi | 98.8 /100 | #92 | Exceptional 65.3% |
| Guyanese | 98.8 /100 | #93 | Exceptional 65.3% |
| Immigrants | Poland | 98.7 /100 | #94 | Exceptional 65.2% |
Demographics Similar to Cherokee by Family Households
In terms of family households, the demographic groups most similar to Cherokee are Immigrants from Iraq (65.0%, a difference of 0.0%), Ecuadorian (65.0%, a difference of 0.010%), Dutch (64.9%, a difference of 0.020%), Argentinean (65.0%, a difference of 0.030%), and Immigrants from Eastern Asia (64.9%, a difference of 0.060%).
| Demographics | Rating | Rank | Family Households |
| Scandinavians | 96.8 /100 | #110 | Exceptional 65.0% |
| Europeans | 96.8 /100 | #111 | Exceptional 65.0% |
| Immigrants | Jordan | 96.5 /100 | #112 | Exceptional 65.0% |
| Spanish | 96.2 /100 | #113 | Exceptional 65.0% |
| Argentineans | 95.7 /100 | #114 | Exceptional 65.0% |
| Ecuadorians | 95.4 /100 | #115 | Exceptional 65.0% |
| Immigrants | Iraq | 95.4 /100 | #116 | Exceptional 65.0% |
| Cherokee | 95.3 /100 | #117 | Exceptional 65.0% |
| Dutch | 95.1 /100 | #118 | Exceptional 64.9% |
| Immigrants | Eastern Asia | 94.4 /100 | #119 | Exceptional 64.9% |
| Immigrants | Oceania | 94.2 /100 | #120 | Exceptional 64.9% |
| Hungarians | 94.0 /100 | #121 | Exceptional 64.9% |
| Hmong | 93.4 /100 | #122 | Exceptional 64.9% |
| Choctaw | 93.4 /100 | #123 | Exceptional 64.9% |
| Immigrants | Argentina | 92.8 /100 | #124 | Exceptional 64.9% |