Bermudan vs Cherokee Unemployment Among Women with Children Ages 6 to 17 years
COMPARE
Bermudan
Cherokee
Unemployment Among Women with Children Ages 6 to 17 years
Unemployment Among Women with Children Ages 6 to 17 years Comparison
Bermudans
Cherokee
10.5%
UNEMPLOYMENT AMONG WOMEN WITH CHILDREN AGES 6 TO 17 YEARS
0.0/ 100
METRIC RATING
317th/ 347
METRIC RANK
10.0%
UNEMPLOYMENT AMONG WOMEN WITH CHILDREN AGES 6 TO 17 YEARS
0.0/ 100
METRIC RATING
295th/ 347
METRIC RANK
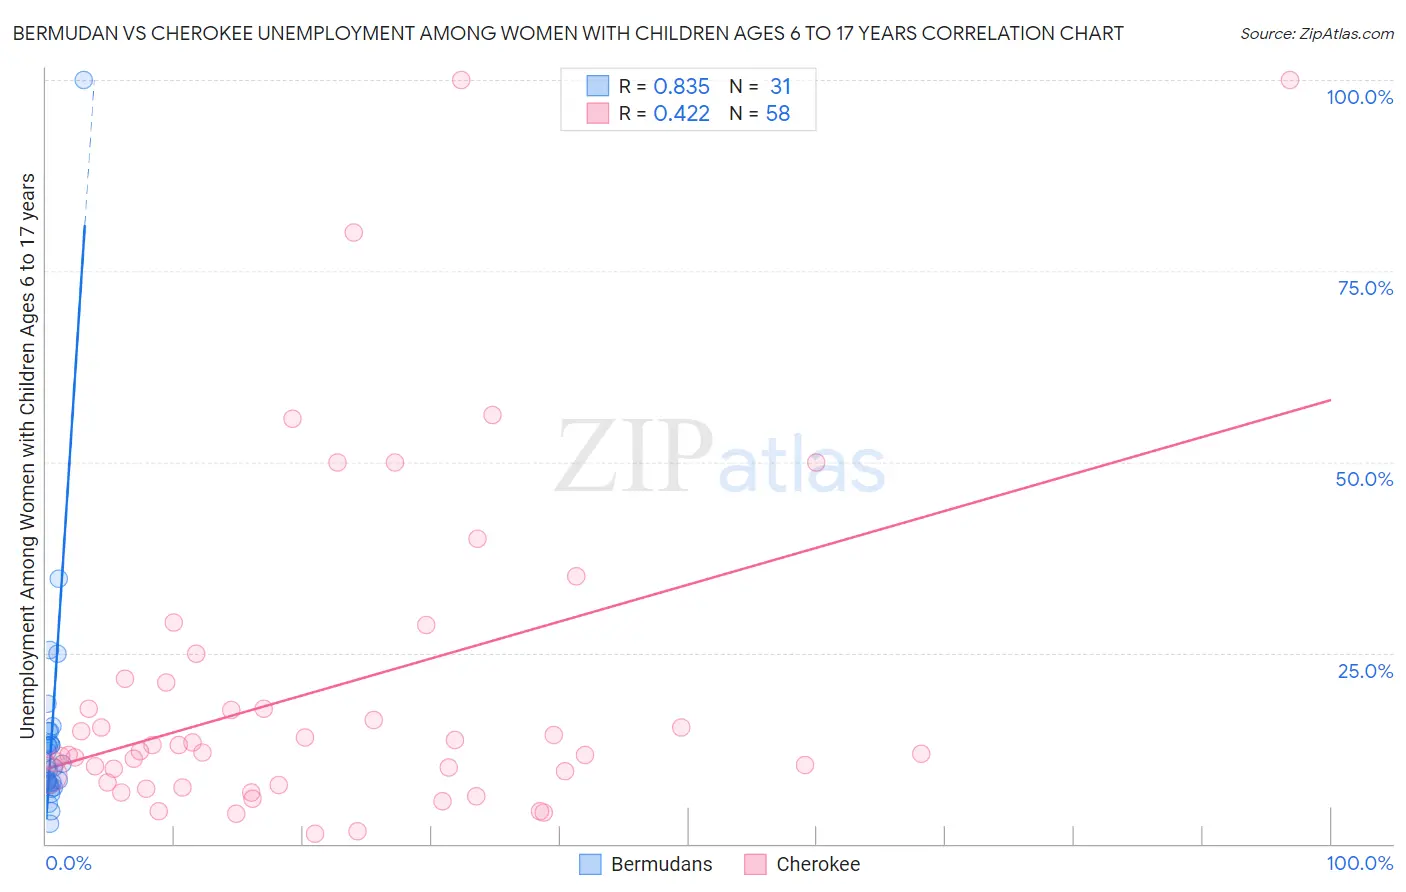
Bermudan vs Cherokee Unemployment Among Women with Children Ages 6 to 17 years Correlation Chart
The statistical analysis conducted on geographies consisting of 51,078,380 people shows a very strong positive correlation between the proportion of Bermudans and unemployment rate among women with children between the ages 6 and 17 in the United States with a correlation coefficient (R) of 0.835 and weighted average of 10.5%. Similarly, the statistical analysis conducted on geographies consisting of 331,434,739 people shows a moderate positive correlation between the proportion of Cherokee and unemployment rate among women with children between the ages 6 and 17 in the United States with a correlation coefficient (R) of 0.422 and weighted average of 10.0%, a difference of 4.8%.
Unemployment Among Women with Children Ages 6 to 17 years Correlation Summary
| Measurement | Bermudan | Cherokee |
| Minimum | 2.7% | 1.3% |
| Maximum | 100.0% | 100.0% |
| Range | 97.3% | 98.7% |
| Mean | 14.7% | 20.4% |
| Median | 10.1% | 12.0% |
| Interquartile 25% (IQ1) | 7.9% | 8.0% |
| Interquartile 75% (IQ3) | 14.7% | 21.1% |
| Interquartile Range (IQR) | 6.9% | 13.2% |
| Standard Deviation (Sample) | 17.2% | 21.9% |
| Standard Deviation (Population) | 16.9% | 21.7% |
Similar Demographics by Unemployment Among Women with Children Ages 6 to 17 years
Demographics Similar to Bermudans by Unemployment Among Women with Children Ages 6 to 17 years
In terms of unemployment among women with children ages 6 to 17 years, the demographic groups most similar to Bermudans are Delaware (10.5%, a difference of 0.020%), Immigrants from Dominica (10.5%, a difference of 0.12%), Bahamian (10.4%, a difference of 0.87%), Immigrants from Cabo Verde (10.4%, a difference of 0.89%), and American (10.4%, a difference of 0.94%).
| Demographics | Rating | Rank | Unemployment Among Women with Children Ages 6 to 17 years |
| Alaska Natives | 0.0 /100 | #310 | Tragic 10.3% |
| Immigrants | Liberia | 0.0 /100 | #311 | Tragic 10.3% |
| Africans | 0.0 /100 | #312 | Tragic 10.4% |
| Americans | 0.0 /100 | #313 | Tragic 10.4% |
| Immigrants | Cabo Verde | 0.0 /100 | #314 | Tragic 10.4% |
| Bahamians | 0.0 /100 | #315 | Tragic 10.4% |
| Immigrants | Dominica | 0.0 /100 | #316 | Tragic 10.5% |
| Bermudans | 0.0 /100 | #317 | Tragic 10.5% |
| Delaware | 0.0 /100 | #318 | Tragic 10.5% |
| Immigrants | Uganda | 0.0 /100 | #319 | Tragic 10.7% |
| Apache | 0.0 /100 | #320 | Tragic 10.7% |
| Tohono O'odham | 0.0 /100 | #321 | Tragic 10.7% |
| Cree | 0.0 /100 | #322 | Tragic 10.8% |
| Dominicans | 0.0 /100 | #323 | Tragic 10.8% |
| Immigrants | Dominican Republic | 0.0 /100 | #324 | Tragic 10.8% |
Demographics Similar to Cherokee by Unemployment Among Women with Children Ages 6 to 17 years
In terms of unemployment among women with children ages 6 to 17 years, the demographic groups most similar to Cherokee are Ecuadorian (10.0%, a difference of 0.030%), Haitian (10.0%, a difference of 0.13%), Carpatho Rusyn (10.0%, a difference of 0.22%), Nonimmigrants (10.0%, a difference of 0.23%), and Subsaharan African (10.0%, a difference of 0.25%).
| Demographics | Rating | Rank | Unemployment Among Women with Children Ages 6 to 17 years |
| Shoshone | 0.0 /100 | #288 | Tragic 10.0% |
| Hondurans | 0.0 /100 | #289 | Tragic 10.0% |
| Sub-Saharan Africans | 0.0 /100 | #290 | Tragic 10.0% |
| Immigrants | Nonimmigrants | 0.0 /100 | #291 | Tragic 10.0% |
| Carpatho Rusyns | 0.0 /100 | #292 | Tragic 10.0% |
| Haitians | 0.0 /100 | #293 | Tragic 10.0% |
| Ecuadorians | 0.0 /100 | #294 | Tragic 10.0% |
| Cherokee | 0.0 /100 | #295 | Tragic 10.0% |
| Immigrants | Western Africa | 0.0 /100 | #296 | Tragic 10.1% |
| Immigrants | Caribbean | 0.0 /100 | #297 | Tragic 10.1% |
| Immigrants | Haiti | 0.0 /100 | #298 | Tragic 10.1% |
| Immigrants | Honduras | 0.0 /100 | #299 | Tragic 10.1% |
| Nigerians | 0.0 /100 | #300 | Tragic 10.1% |
| Immigrants | Bahamas | 0.0 /100 | #301 | Tragic 10.1% |
| Venezuelans | 0.0 /100 | #302 | Tragic 10.2% |