Cape Verdean vs Native/Alaskan Unemployment Among Women with Children Under 6 years
COMPARE
Cape Verdean
Native/Alaskan
Unemployment Among Women with Children Under 6 years
Unemployment Among Women with Children Under 6 years Comparison
Cape Verdeans
Natives/Alaskans
5.9%
UNEMPLOYMENT AMONG WOMEN WITH CHILDREN UNDER 6 YEARS
100.0/ 100
METRIC RATING
5th/ 347
METRIC RANK
11.5%
UNEMPLOYMENT AMONG WOMEN WITH CHILDREN UNDER 6 YEARS
0.0/ 100
METRIC RATING
333rd/ 347
METRIC RANK
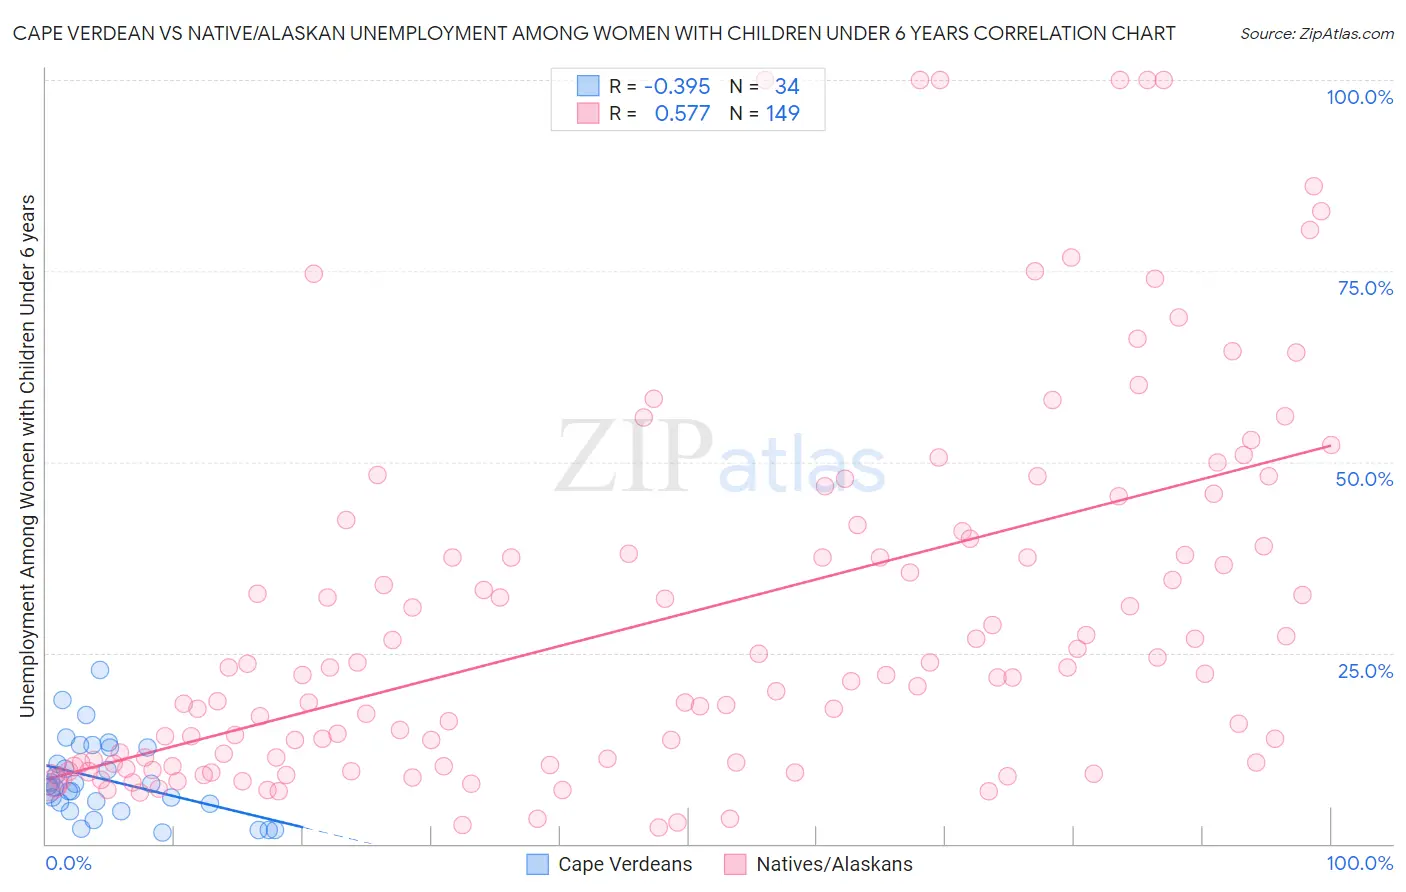
Cape Verdean vs Native/Alaskan Unemployment Among Women with Children Under 6 years Correlation Chart
The statistical analysis conducted on geographies consisting of 96,300,007 people shows a mild negative correlation between the proportion of Cape Verdeans and unemployment rate among women with children under the age of 6 in the United States with a correlation coefficient (R) of -0.395 and weighted average of 5.9%. Similarly, the statistical analysis conducted on geographies consisting of 362,805,436 people shows a substantial positive correlation between the proportion of Natives/Alaskans and unemployment rate among women with children under the age of 6 in the United States with a correlation coefficient (R) of 0.577 and weighted average of 11.5%, a difference of 93.8%.
Unemployment Among Women with Children Under 6 years Correlation Summary
| Measurement | Cape Verdean | Native/Alaskan |
| Minimum | 1.4% | 2.2% |
| Maximum | 22.8% | 100.0% |
| Range | 21.4% | 97.8% |
| Mean | 8.3% | 29.8% |
| Median | 7.5% | 22.1% |
| Interquartile 25% (IQ1) | 5.2% | 10.5% |
| Interquartile 75% (IQ3) | 12.6% | 40.5% |
| Interquartile Range (IQR) | 7.4% | 29.9% |
| Standard Deviation (Sample) | 5.1% | 24.3% |
| Standard Deviation (Population) | 5.0% | 24.2% |
Similar Demographics by Unemployment Among Women with Children Under 6 years
Demographics Similar to Cape Verdeans by Unemployment Among Women with Children Under 6 years
In terms of unemployment among women with children under 6 years, the demographic groups most similar to Cape Verdeans are Cambodian (5.9%, a difference of 1.0%), Immigrants from Taiwan (6.0%, a difference of 1.7%), Okinawan (5.8%, a difference of 1.9%), Taiwanese (6.1%, a difference of 2.2%), and Immigrants from India (6.1%, a difference of 2.7%).
| Demographics | Rating | Rank | Unemployment Among Women with Children Under 6 years |
| Immigrants | Cabo Verde | 100.0 /100 | #1 | Exceptional 5.4% |
| Immigrants | Hong Kong | 100.0 /100 | #2 | Exceptional 5.8% |
| Okinawans | 100.0 /100 | #3 | Exceptional 5.8% |
| Cambodians | 100.0 /100 | #4 | Exceptional 5.9% |
| Cape Verdeans | 100.0 /100 | #5 | Exceptional 5.9% |
| Immigrants | Taiwan | 100.0 /100 | #6 | Exceptional 6.0% |
| Taiwanese | 100.0 /100 | #7 | Exceptional 6.1% |
| Immigrants | India | 100.0 /100 | #8 | Exceptional 6.1% |
| Filipinos | 100.0 /100 | #9 | Exceptional 6.1% |
| Immigrants | China | 100.0 /100 | #10 | Exceptional 6.2% |
| Indians (Asian) | 100.0 /100 | #11 | Exceptional 6.3% |
| Immigrants | Singapore | 100.0 /100 | #12 | Exceptional 6.3% |
| Immigrants | Eastern Asia | 100.0 /100 | #13 | Exceptional 6.3% |
| Immigrants | Bulgaria | 100.0 /100 | #14 | Exceptional 6.3% |
| Thais | 100.0 /100 | #15 | Exceptional 6.3% |
Demographics Similar to Natives/Alaskans by Unemployment Among Women with Children Under 6 years
In terms of unemployment among women with children under 6 years, the demographic groups most similar to Natives/Alaskans are Sioux (11.5%, a difference of 0.56%), Colville (11.2%, a difference of 3.3%), Apache (12.3%, a difference of 6.9%), Pennsylvania German (10.8%, a difference of 7.0%), and Puerto Rican (12.5%, a difference of 8.8%).
| Demographics | Rating | Rank | Unemployment Among Women with Children Under 6 years |
| Delaware | 0.0 /100 | #326 | Tragic 9.8% |
| Ottawa | 0.0 /100 | #327 | Tragic 9.9% |
| Tohono O'odham | 0.0 /100 | #328 | Tragic 10.2% |
| Blacks/African Americans | 0.0 /100 | #329 | Tragic 10.3% |
| Pennsylvania Germans | 0.0 /100 | #330 | Tragic 10.8% |
| Colville | 0.0 /100 | #331 | Tragic 11.2% |
| Sioux | 0.0 /100 | #332 | Tragic 11.5% |
| Natives/Alaskans | 0.0 /100 | #333 | Tragic 11.5% |
| Apache | 0.0 /100 | #334 | Tragic 12.3% |
| Puerto Ricans | 0.0 /100 | #335 | Tragic 12.5% |
| Shoshone | 0.0 /100 | #336 | Tragic 13.2% |
| Chippewa | 0.0 /100 | #337 | Tragic 13.3% |
| Pima | 0.0 /100 | #338 | Tragic 13.4% |
| Navajo | 0.0 /100 | #339 | Tragic 13.5% |
| Immigrants | Yemen | 0.0 /100 | #340 | Tragic 13.5% |