Hmong vs Native/Alaskan Unemployment Among Women with Children Under 6 years
COMPARE
Hmong
Native/Alaskan
Unemployment Among Women with Children Under 6 years
Unemployment Among Women with Children Under 6 years Comparison
Hmong
Natives/Alaskans
6.7%
UNEMPLOYMENT AMONG WOMEN WITH CHILDREN UNDER 6 YEARS
100.0/ 100
METRIC RATING
38th/ 347
METRIC RANK
11.5%
UNEMPLOYMENT AMONG WOMEN WITH CHILDREN UNDER 6 YEARS
0.0/ 100
METRIC RATING
333rd/ 347
METRIC RANK
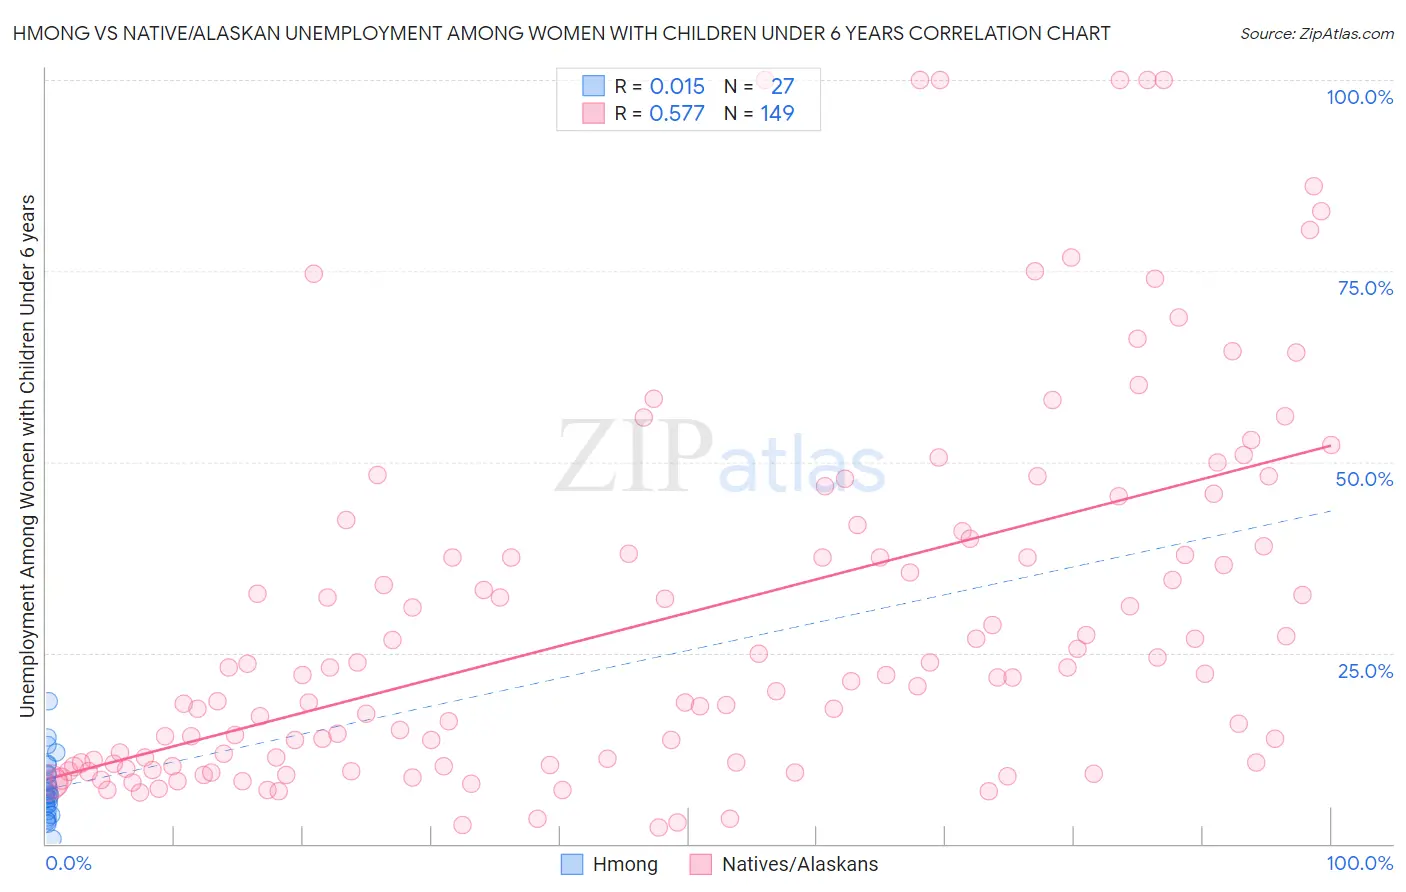
Hmong vs Native/Alaskan Unemployment Among Women with Children Under 6 years Correlation Chart
The statistical analysis conducted on geographies consisting of 24,062,767 people shows no correlation between the proportion of Hmong and unemployment rate among women with children under the age of 6 in the United States with a correlation coefficient (R) of 0.015 and weighted average of 6.7%. Similarly, the statistical analysis conducted on geographies consisting of 362,805,436 people shows a substantial positive correlation between the proportion of Natives/Alaskans and unemployment rate among women with children under the age of 6 in the United States with a correlation coefficient (R) of 0.577 and weighted average of 11.5%, a difference of 73.2%.
Unemployment Among Women with Children Under 6 years Correlation Summary
| Measurement | Hmong | Native/Alaskan |
| Minimum | 0.60% | 2.2% |
| Maximum | 18.7% | 100.0% |
| Range | 18.1% | 97.8% |
| Mean | 7.2% | 29.8% |
| Median | 6.4% | 22.1% |
| Interquartile 25% (IQ1) | 4.3% | 10.5% |
| Interquartile 75% (IQ3) | 9.2% | 40.5% |
| Interquartile Range (IQR) | 4.9% | 29.9% |
| Standard Deviation (Sample) | 4.0% | 24.3% |
| Standard Deviation (Population) | 3.9% | 24.2% |
Similar Demographics by Unemployment Among Women with Children Under 6 years
Demographics Similar to Hmong by Unemployment Among Women with Children Under 6 years
In terms of unemployment among women with children under 6 years, the demographic groups most similar to Hmong are Immigrants from Russia (6.7%, a difference of 0.060%), Sri Lankan (6.6%, a difference of 0.13%), Asian (6.7%, a difference of 0.28%), Luxembourger (6.6%, a difference of 0.38%), and Immigrants from Indonesia (6.7%, a difference of 0.44%).
| Demographics | Rating | Rank | Unemployment Among Women with Children Under 6 years |
| Immigrants | Moldova | 100.0 /100 | #31 | Exceptional 6.6% |
| Tsimshian | 100.0 /100 | #32 | Exceptional 6.6% |
| Immigrants | Vietnam | 100.0 /100 | #33 | Exceptional 6.6% |
| Immigrants | South Central Asia | 100.0 /100 | #34 | Exceptional 6.6% |
| Yakama | 100.0 /100 | #35 | Exceptional 6.6% |
| Luxembourgers | 100.0 /100 | #36 | Exceptional 6.6% |
| Sri Lankans | 100.0 /100 | #37 | Exceptional 6.6% |
| Hmong | 100.0 /100 | #38 | Exceptional 6.7% |
| Immigrants | Russia | 100.0 /100 | #39 | Exceptional 6.7% |
| Asians | 100.0 /100 | #40 | Exceptional 6.7% |
| Immigrants | Indonesia | 99.9 /100 | #41 | Exceptional 6.7% |
| Immigrants | Cuba | 99.9 /100 | #42 | Exceptional 6.7% |
| Bhutanese | 99.9 /100 | #43 | Exceptional 6.7% |
| Iranians | 99.9 /100 | #44 | Exceptional 6.7% |
| Immigrants | Australia | 99.9 /100 | #45 | Exceptional 6.8% |
Demographics Similar to Natives/Alaskans by Unemployment Among Women with Children Under 6 years
In terms of unemployment among women with children under 6 years, the demographic groups most similar to Natives/Alaskans are Sioux (11.5%, a difference of 0.56%), Colville (11.2%, a difference of 3.3%), Apache (12.3%, a difference of 6.9%), Pennsylvania German (10.8%, a difference of 7.0%), and Puerto Rican (12.5%, a difference of 8.8%).
| Demographics | Rating | Rank | Unemployment Among Women with Children Under 6 years |
| Delaware | 0.0 /100 | #326 | Tragic 9.8% |
| Ottawa | 0.0 /100 | #327 | Tragic 9.9% |
| Tohono O'odham | 0.0 /100 | #328 | Tragic 10.2% |
| Blacks/African Americans | 0.0 /100 | #329 | Tragic 10.3% |
| Pennsylvania Germans | 0.0 /100 | #330 | Tragic 10.8% |
| Colville | 0.0 /100 | #331 | Tragic 11.2% |
| Sioux | 0.0 /100 | #332 | Tragic 11.5% |
| Natives/Alaskans | 0.0 /100 | #333 | Tragic 11.5% |
| Apache | 0.0 /100 | #334 | Tragic 12.3% |
| Puerto Ricans | 0.0 /100 | #335 | Tragic 12.5% |
| Shoshone | 0.0 /100 | #336 | Tragic 13.2% |
| Chippewa | 0.0 /100 | #337 | Tragic 13.3% |
| Pima | 0.0 /100 | #338 | Tragic 13.4% |
| Navajo | 0.0 /100 | #339 | Tragic 13.5% |
| Immigrants | Yemen | 0.0 /100 | #340 | Tragic 13.5% |