Immigrants from Ecuador vs Immigrants from Western Asia Unemployment Among Women with Children Under 6 years
COMPARE
Immigrants from Ecuador
Immigrants from Western Asia
Unemployment Among Women with Children Under 6 years
Unemployment Among Women with Children Under 6 years Comparison
Immigrants from Ecuador
Immigrants from Western Asia
7.9%
UNEMPLOYMENT AMONG WOMEN WITH CHILDREN UNDER 6 YEARS
14.9/ 100
METRIC RATING
211th/ 347
METRIC RANK
7.5%
UNEMPLOYMENT AMONG WOMEN WITH CHILDREN UNDER 6 YEARS
70.2/ 100
METRIC RATING
161st/ 347
METRIC RANK
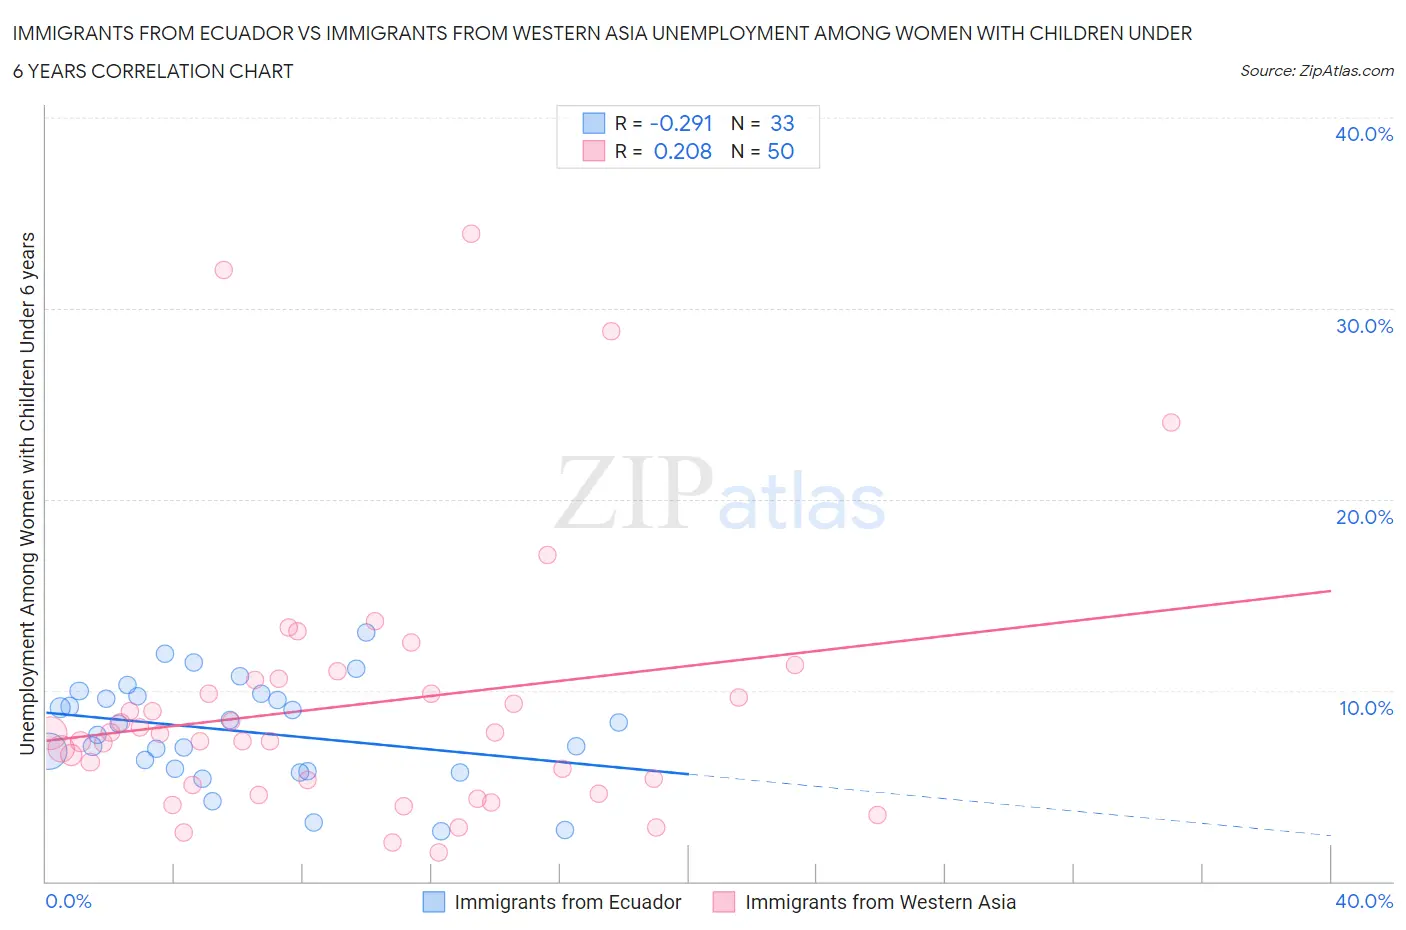
Immigrants from Ecuador vs Immigrants from Western Asia Unemployment Among Women with Children Under 6 years Correlation Chart
The statistical analysis conducted on geographies consisting of 223,112,297 people shows a weak negative correlation between the proportion of Immigrants from Ecuador and unemployment rate among women with children under the age of 6 in the United States with a correlation coefficient (R) of -0.291 and weighted average of 7.9%. Similarly, the statistical analysis conducted on geographies consisting of 307,875,310 people shows a weak positive correlation between the proportion of Immigrants from Western Asia and unemployment rate among women with children under the age of 6 in the United States with a correlation coefficient (R) of 0.208 and weighted average of 7.5%, a difference of 4.4%.
Unemployment Among Women with Children Under 6 years Correlation Summary
| Measurement | Immigrants from Ecuador | Immigrants from Western Asia |
| Minimum | 2.6% | 1.5% |
| Maximum | 13.0% | 33.9% |
| Range | 10.4% | 32.4% |
| Mean | 7.8% | 9.3% |
| Median | 8.2% | 7.8% |
| Interquartile 25% (IQ1) | 5.8% | 5.0% |
| Interquartile 75% (IQ3) | 9.7% | 10.5% |
| Interquartile Range (IQR) | 3.9% | 5.5% |
| Standard Deviation (Sample) | 2.6% | 7.0% |
| Standard Deviation (Population) | 2.6% | 6.9% |
Similar Demographics by Unemployment Among Women with Children Under 6 years
Demographics Similar to Immigrants from Ecuador by Unemployment Among Women with Children Under 6 years
In terms of unemployment among women with children under 6 years, the demographic groups most similar to Immigrants from Ecuador are Polish (7.9%, a difference of 0.13%), Costa Rican (7.8%, a difference of 0.31%), Swiss (7.9%, a difference of 0.37%), Immigrants from Syria (7.8%, a difference of 0.45%), and Scottish (7.9%, a difference of 0.50%).
| Demographics | Rating | Rank | Unemployment Among Women with Children Under 6 years |
| Lebanese | 22.2 /100 | #204 | Fair 7.8% |
| Immigrants | Immigrants | 21.4 /100 | #205 | Fair 7.8% |
| Hungarians | 21.2 /100 | #206 | Fair 7.8% |
| Canadians | 20.6 /100 | #207 | Fair 7.8% |
| Immigrants | Syria | 18.9 /100 | #208 | Poor 7.8% |
| Costa Ricans | 17.6 /100 | #209 | Poor 7.8% |
| Poles | 16.0 /100 | #210 | Poor 7.9% |
| Immigrants | Ecuador | 14.9 /100 | #211 | Poor 7.9% |
| Swiss | 12.3 /100 | #212 | Poor 7.9% |
| Scottish | 11.4 /100 | #213 | Poor 7.9% |
| Spanish | 11.3 /100 | #214 | Poor 7.9% |
| Ecuadorians | 11.2 /100 | #215 | Poor 7.9% |
| Immigrants | Lebanon | 11.1 /100 | #216 | Poor 7.9% |
| Immigrants | Nigeria | 10.3 /100 | #217 | Poor 7.9% |
| Moroccans | 9.7 /100 | #218 | Tragic 7.9% |
Demographics Similar to Immigrants from Western Asia by Unemployment Among Women with Children Under 6 years
In terms of unemployment among women with children under 6 years, the demographic groups most similar to Immigrants from Western Asia are Bolivian (7.5%, a difference of 0.040%), Immigrants from Philippines (7.5%, a difference of 0.080%), Immigrants from Lithuania (7.5%, a difference of 0.12%), Croatian (7.5%, a difference of 0.14%), and Peruvian (7.5%, a difference of 0.17%).
| Demographics | Rating | Rank | Unemployment Among Women with Children Under 6 years |
| Northern Europeans | 74.3 /100 | #154 | Good 7.5% |
| South Americans | 74.1 /100 | #155 | Good 7.5% |
| Immigrants | Southern Europe | 73.2 /100 | #156 | Good 7.5% |
| Peruvians | 72.3 /100 | #157 | Good 7.5% |
| Croatians | 71.9 /100 | #158 | Good 7.5% |
| Immigrants | Philippines | 71.3 /100 | #159 | Good 7.5% |
| Bolivians | 70.8 /100 | #160 | Good 7.5% |
| Immigrants | Western Asia | 70.2 /100 | #161 | Good 7.5% |
| Immigrants | Lithuania | 68.8 /100 | #162 | Good 7.5% |
| British | 66.3 /100 | #163 | Good 7.6% |
| Ugandans | 65.8 /100 | #164 | Good 7.6% |
| Immigrants | South America | 65.6 /100 | #165 | Good 7.6% |
| Belgians | 63.5 /100 | #166 | Good 7.6% |
| Kenyans | 62.5 /100 | #167 | Good 7.6% |
| Immigrants | Canada | 61.6 /100 | #168 | Good 7.6% |