Immigrants from Philippines vs Native/Alaskan Unemployment Among Women with Children Under 6 years
COMPARE
Immigrants from Philippines
Native/Alaskan
Unemployment Among Women with Children Under 6 years
Unemployment Among Women with Children Under 6 years Comparison
Immigrants from Philippines
Natives/Alaskans
7.5%
UNEMPLOYMENT AMONG WOMEN WITH CHILDREN UNDER 6 YEARS
71.3/ 100
METRIC RATING
159th/ 347
METRIC RANK
11.5%
UNEMPLOYMENT AMONG WOMEN WITH CHILDREN UNDER 6 YEARS
0.0/ 100
METRIC RATING
333rd/ 347
METRIC RANK
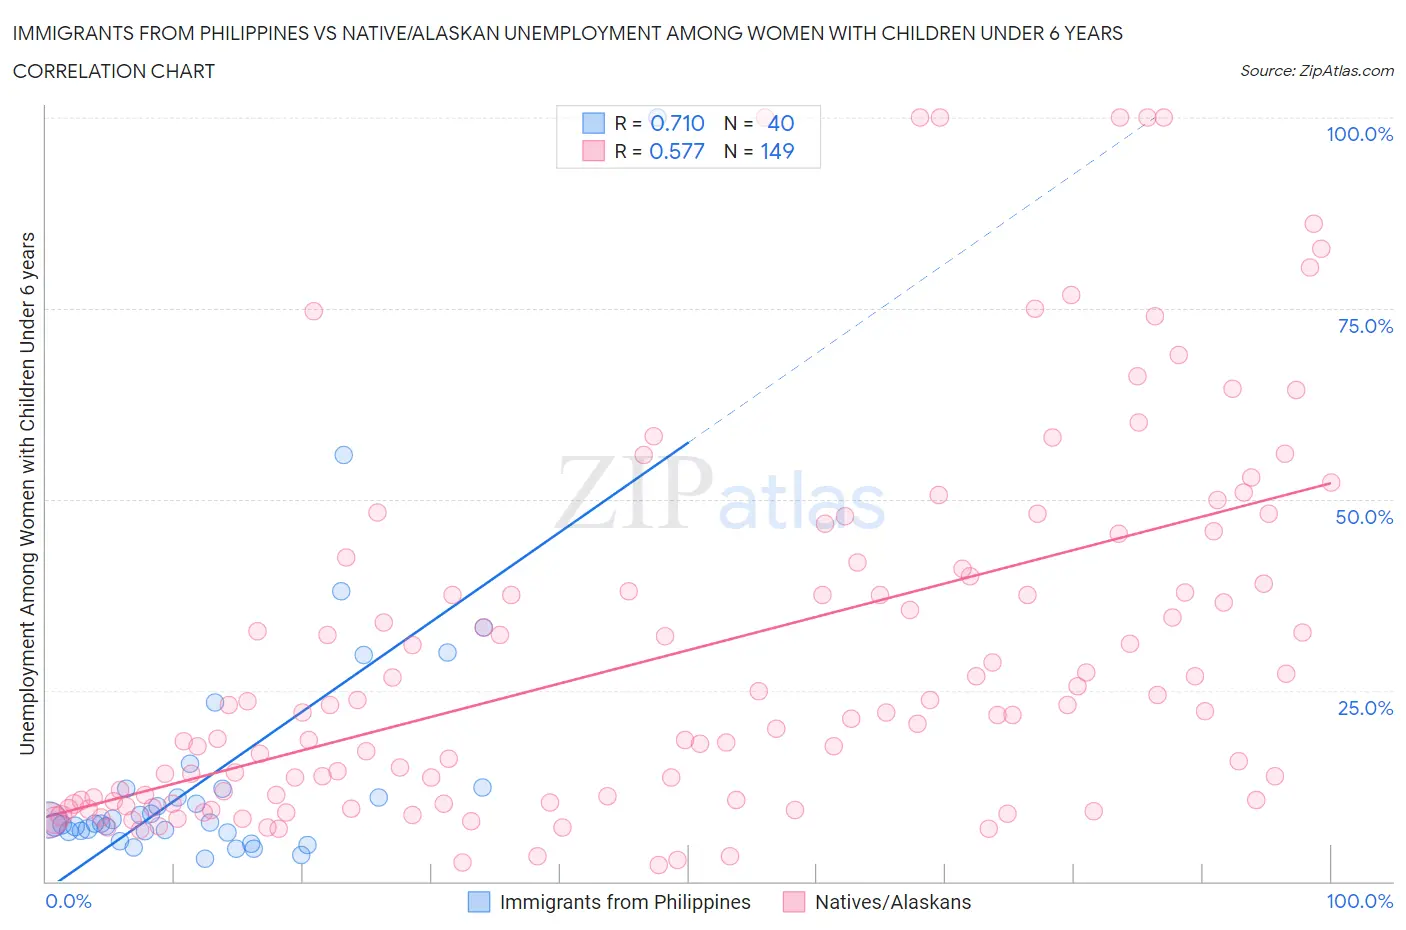
Immigrants from Philippines vs Native/Alaskan Unemployment Among Women with Children Under 6 years Correlation Chart
The statistical analysis conducted on geographies consisting of 343,754,489 people shows a strong positive correlation between the proportion of Immigrants from Philippines and unemployment rate among women with children under the age of 6 in the United States with a correlation coefficient (R) of 0.710 and weighted average of 7.5%. Similarly, the statistical analysis conducted on geographies consisting of 362,805,436 people shows a substantial positive correlation between the proportion of Natives/Alaskans and unemployment rate among women with children under the age of 6 in the United States with a correlation coefficient (R) of 0.577 and weighted average of 11.5%, a difference of 53.0%.
Unemployment Among Women with Children Under 6 years Correlation Summary
| Measurement | Immigrants from Philippines | Native/Alaskan |
| Minimum | 3.0% | 2.2% |
| Maximum | 100.0% | 100.0% |
| Range | 97.0% | 97.8% |
| Mean | 14.1% | 29.8% |
| Median | 7.6% | 22.1% |
| Interquartile 25% (IQ1) | 6.5% | 10.5% |
| Interquartile 75% (IQ3) | 12.1% | 40.5% |
| Interquartile Range (IQR) | 5.5% | 29.9% |
| Standard Deviation (Sample) | 17.7% | 24.3% |
| Standard Deviation (Population) | 17.5% | 24.2% |
Similar Demographics by Unemployment Among Women with Children Under 6 years
Demographics Similar to Immigrants from Philippines by Unemployment Among Women with Children Under 6 years
In terms of unemployment among women with children under 6 years, the demographic groups most similar to Immigrants from Philippines are Bolivian (7.5%, a difference of 0.040%), Croatian (7.5%, a difference of 0.050%), Peruvian (7.5%, a difference of 0.080%), Immigrants from Western Asia (7.5%, a difference of 0.080%), and Immigrants from Southern Europe (7.5%, a difference of 0.17%).
| Demographics | Rating | Rank | Unemployment Among Women with Children Under 6 years |
| Bangladeshis | 74.8 /100 | #152 | Good 7.5% |
| Uruguayans | 74.7 /100 | #153 | Good 7.5% |
| Northern Europeans | 74.3 /100 | #154 | Good 7.5% |
| South Americans | 74.1 /100 | #155 | Good 7.5% |
| Immigrants | Southern Europe | 73.2 /100 | #156 | Good 7.5% |
| Peruvians | 72.3 /100 | #157 | Good 7.5% |
| Croatians | 71.9 /100 | #158 | Good 7.5% |
| Immigrants | Philippines | 71.3 /100 | #159 | Good 7.5% |
| Bolivians | 70.8 /100 | #160 | Good 7.5% |
| Immigrants | Western Asia | 70.2 /100 | #161 | Good 7.5% |
| Immigrants | Lithuania | 68.8 /100 | #162 | Good 7.5% |
| British | 66.3 /100 | #163 | Good 7.6% |
| Ugandans | 65.8 /100 | #164 | Good 7.6% |
| Immigrants | South America | 65.6 /100 | #165 | Good 7.6% |
| Belgians | 63.5 /100 | #166 | Good 7.6% |
Demographics Similar to Natives/Alaskans by Unemployment Among Women with Children Under 6 years
In terms of unemployment among women with children under 6 years, the demographic groups most similar to Natives/Alaskans are Sioux (11.5%, a difference of 0.56%), Colville (11.2%, a difference of 3.3%), Apache (12.3%, a difference of 6.9%), Pennsylvania German (10.8%, a difference of 7.0%), and Puerto Rican (12.5%, a difference of 8.8%).
| Demographics | Rating | Rank | Unemployment Among Women with Children Under 6 years |
| Delaware | 0.0 /100 | #326 | Tragic 9.8% |
| Ottawa | 0.0 /100 | #327 | Tragic 9.9% |
| Tohono O'odham | 0.0 /100 | #328 | Tragic 10.2% |
| Blacks/African Americans | 0.0 /100 | #329 | Tragic 10.3% |
| Pennsylvania Germans | 0.0 /100 | #330 | Tragic 10.8% |
| Colville | 0.0 /100 | #331 | Tragic 11.2% |
| Sioux | 0.0 /100 | #332 | Tragic 11.5% |
| Natives/Alaskans | 0.0 /100 | #333 | Tragic 11.5% |
| Apache | 0.0 /100 | #334 | Tragic 12.3% |
| Puerto Ricans | 0.0 /100 | #335 | Tragic 12.5% |
| Shoshone | 0.0 /100 | #336 | Tragic 13.2% |
| Chippewa | 0.0 /100 | #337 | Tragic 13.3% |
| Pima | 0.0 /100 | #338 | Tragic 13.4% |
| Navajo | 0.0 /100 | #339 | Tragic 13.5% |
| Immigrants | Yemen | 0.0 /100 | #340 | Tragic 13.5% |