Immigrants from Ecuador vs Immigrants from El Salvador Unemployment
COMPARE
Immigrants from Ecuador
Immigrants from El Salvador
Unemployment
Unemployment Comparison
Immigrants from Ecuador
Immigrants from El Salvador
6.2%
UNEMPLOYMENT
0.0/ 100
METRIC RATING
293rd/ 347
METRIC RANK
5.8%
UNEMPLOYMENT
0.1/ 100
METRIC RATING
269th/ 347
METRIC RANK
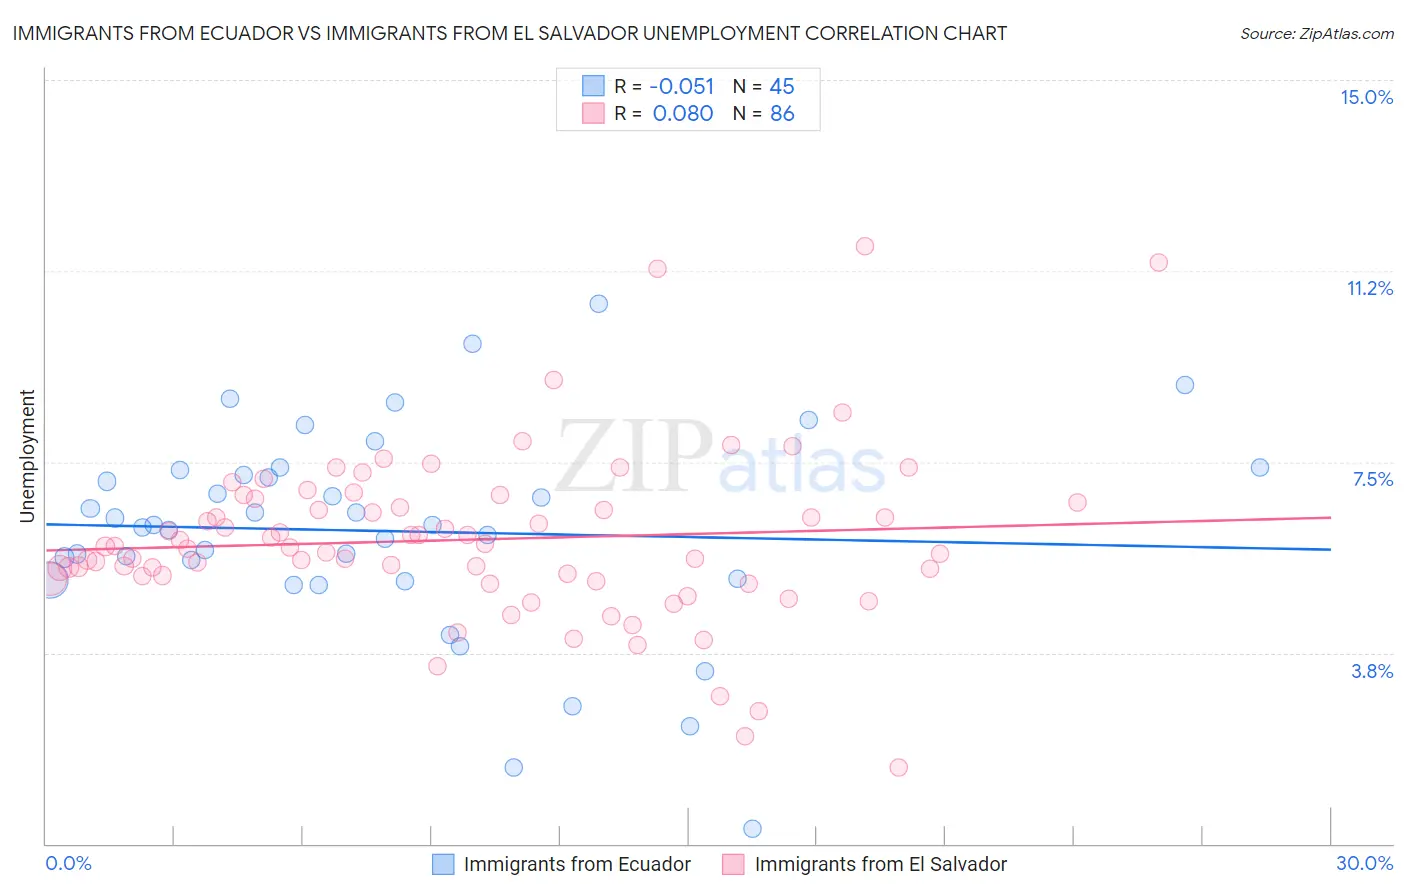
Immigrants from Ecuador vs Immigrants from El Salvador Unemployment Correlation Chart
The statistical analysis conducted on geographies consisting of 270,858,036 people shows a slight negative correlation between the proportion of Immigrants from Ecuador and unemployment in the United States with a correlation coefficient (R) of -0.051 and weighted average of 6.2%. Similarly, the statistical analysis conducted on geographies consisting of 357,477,552 people shows a slight positive correlation between the proportion of Immigrants from El Salvador and unemployment in the United States with a correlation coefficient (R) of 0.080 and weighted average of 5.8%, a difference of 6.9%.
Unemployment Correlation Summary
| Measurement | Immigrants from Ecuador | Immigrants from El Salvador |
| Minimum | 0.30% | 1.5% |
| Maximum | 10.6% | 11.7% |
| Range | 10.3% | 10.2% |
| Mean | 6.1% | 6.0% |
| Median | 6.3% | 5.8% |
| Interquartile 25% (IQ1) | 5.2% | 5.3% |
| Interquartile 75% (IQ3) | 7.3% | 6.7% |
| Interquartile Range (IQR) | 2.1% | 1.4% |
| Standard Deviation (Sample) | 2.0% | 1.7% |
| Standard Deviation (Population) | 2.0% | 1.7% |
Similar Demographics by Unemployment
Demographics Similar to Immigrants from Ecuador by Unemployment
In terms of unemployment, the demographic groups most similar to Immigrants from Ecuador are Spanish American Indian (6.2%, a difference of 0.0%), Central American Indian (6.2%, a difference of 0.090%), Haitian (6.2%, a difference of 0.11%), U.S. Virgin Islander (6.3%, a difference of 0.12%), and Ute (6.3%, a difference of 0.57%).
| Demographics | Rating | Rank | Unemployment |
| Immigrants | Caribbean | 0.0 /100 | #286 | Tragic 6.2% |
| Nepalese | 0.0 /100 | #287 | Tragic 6.2% |
| Ecuadorians | 0.0 /100 | #288 | Tragic 6.2% |
| Chippewa | 0.0 /100 | #289 | Tragic 6.2% |
| Senegalese | 0.0 /100 | #290 | Tragic 6.2% |
| Haitians | 0.0 /100 | #291 | Tragic 6.2% |
| Central American Indians | 0.0 /100 | #292 | Tragic 6.2% |
| Immigrants | Ecuador | 0.0 /100 | #293 | Tragic 6.2% |
| Spanish American Indians | 0.0 /100 | #294 | Tragic 6.2% |
| U.S. Virgin Islanders | 0.0 /100 | #295 | Tragic 6.3% |
| Ute | 0.0 /100 | #296 | Tragic 6.3% |
| Jamaicans | 0.0 /100 | #297 | Tragic 6.3% |
| Immigrants | Haiti | 0.0 /100 | #298 | Tragic 6.3% |
| Immigrants | West Indies | 0.0 /100 | #299 | Tragic 6.3% |
| Immigrants | Trinidad and Tobago | 0.0 /100 | #300 | Tragic 6.3% |
Demographics Similar to Immigrants from El Salvador by Unemployment
In terms of unemployment, the demographic groups most similar to Immigrants from El Salvador are Immigrants from Sierra Leone (5.8%, a difference of 0.010%), Immigrants from Nigeria (5.8%, a difference of 0.050%), Blackfeet (5.8%, a difference of 0.080%), Mexican American Indian (5.8%, a difference of 0.12%), and Mexican (5.9%, a difference of 0.31%).
| Demographics | Rating | Rank | Unemployment |
| Sierra Leoneans | 0.1 /100 | #262 | Tragic 5.8% |
| Salvadorans | 0.1 /100 | #263 | Tragic 5.8% |
| Immigrants | Liberia | 0.1 /100 | #264 | Tragic 5.8% |
| Nigerians | 0.1 /100 | #265 | Tragic 5.8% |
| Mexican American Indians | 0.1 /100 | #266 | Tragic 5.8% |
| Immigrants | Nigeria | 0.1 /100 | #267 | Tragic 5.8% |
| Immigrants | Sierra Leone | 0.1 /100 | #268 | Tragic 5.8% |
| Immigrants | El Salvador | 0.1 /100 | #269 | Tragic 5.8% |
| Blackfeet | 0.1 /100 | #270 | Tragic 5.8% |
| Mexicans | 0.1 /100 | #271 | Tragic 5.9% |
| Hispanics or Latinos | 0.0 /100 | #272 | Tragic 5.9% |
| Immigrants | Fiji | 0.0 /100 | #273 | Tragic 5.9% |
| Bahamians | 0.0 /100 | #274 | Tragic 5.9% |
| Immigrants | Latin America | 0.0 /100 | #275 | Tragic 5.9% |
| Immigrants | Central America | 0.0 /100 | #276 | Tragic 6.0% |