Immigrants from Ecuador vs Immigrants from Senegal Kindergarten
COMPARE
Immigrants from Ecuador
Immigrants from Senegal
Kindergarten
Kindergarten Comparison
Immigrants from Ecuador
Immigrants from Senegal
96.9%
KINDERGARTEN
0.0/ 100
METRIC RATING
317th/ 347
METRIC RANK
97.6%
KINDERGARTEN
0.9/ 100
METRIC RATING
250th/ 347
METRIC RANK
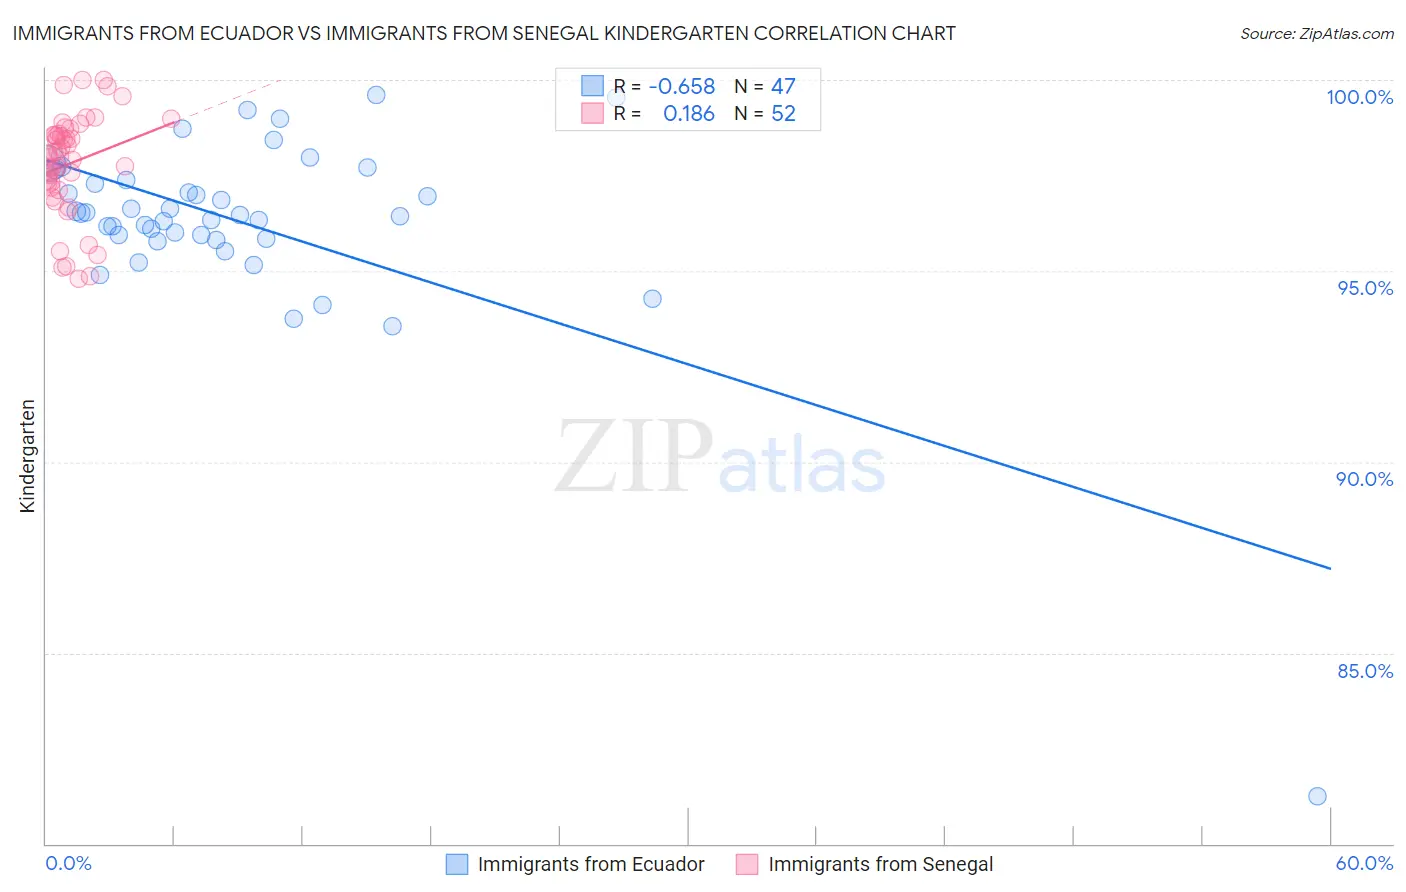
Immigrants from Ecuador vs Immigrants from Senegal Kindergarten Correlation Chart
The statistical analysis conducted on geographies consisting of 271,020,679 people shows a significant negative correlation between the proportion of Immigrants from Ecuador and percentage of population with at least kindergarten education in the United States with a correlation coefficient (R) of -0.658 and weighted average of 96.9%. Similarly, the statistical analysis conducted on geographies consisting of 90,130,297 people shows a poor positive correlation between the proportion of Immigrants from Senegal and percentage of population with at least kindergarten education in the United States with a correlation coefficient (R) of 0.186 and weighted average of 97.6%, a difference of 0.72%.
Kindergarten Correlation Summary
| Measurement | Immigrants from Ecuador | Immigrants from Senegal |
| Minimum | 81.2% | 94.8% |
| Maximum | 99.6% | 100.0% |
| Range | 18.3% | 5.2% |
| Mean | 96.3% | 97.8% |
| Median | 96.5% | 98.0% |
| Interquartile 25% (IQ1) | 95.8% | 97.2% |
| Interquartile 75% (IQ3) | 97.4% | 98.6% |
| Interquartile Range (IQR) | 1.5% | 1.3% |
| Standard Deviation (Sample) | 2.6% | 1.3% |
| Standard Deviation (Population) | 2.6% | 1.3% |
Similar Demographics by Kindergarten
Demographics Similar to Immigrants from Ecuador by Kindergarten
In terms of kindergarten, the demographic groups most similar to Immigrants from Ecuador are Immigrants from Nicaragua (96.9%, a difference of 0.0%), Immigrants from Belize (96.9%, a difference of 0.010%), Cape Verdean (96.9%, a difference of 0.030%), Honduran (96.9%, a difference of 0.030%), and Guyanese (96.9%, a difference of 0.040%).
| Demographics | Rating | Rank | Kindergarten |
| Immigrants | Azores | 0.0 /100 | #310 | Tragic 97.0% |
| Sri Lankans | 0.0 /100 | #311 | Tragic 97.0% |
| Guyanese | 0.0 /100 | #312 | Tragic 96.9% |
| Cape Verdeans | 0.0 /100 | #313 | Tragic 96.9% |
| Hondurans | 0.0 /100 | #314 | Tragic 96.9% |
| Immigrants | Belize | 0.0 /100 | #315 | Tragic 96.9% |
| Immigrants | Nicaragua | 0.0 /100 | #316 | Tragic 96.9% |
| Immigrants | Ecuador | 0.0 /100 | #317 | Tragic 96.9% |
| Immigrants | Laos | 0.0 /100 | #318 | Tragic 96.9% |
| Immigrants | Guyana | 0.0 /100 | #319 | Tragic 96.8% |
| Immigrants | Burma/Myanmar | 0.0 /100 | #320 | Tragic 96.8% |
| Immigrants | Bangladesh | 0.0 /100 | #321 | Tragic 96.8% |
| Mexican American Indians | 0.0 /100 | #322 | Tragic 96.8% |
| Immigrants | Honduras | 0.0 /100 | #323 | Tragic 96.8% |
| Vietnamese | 0.0 /100 | #324 | Tragic 96.8% |
Demographics Similar to Immigrants from Senegal by Kindergarten
In terms of kindergarten, the demographic groups most similar to Immigrants from Senegal are Peruvian (97.6%, a difference of 0.0%), Ethiopian (97.6%, a difference of 0.0%), South American (97.6%, a difference of 0.010%), Indian (Asian) (97.6%, a difference of 0.010%), and Immigrants from Eastern Africa (97.6%, a difference of 0.010%).
| Demographics | Rating | Rank | Kindergarten |
| Asians | 1.2 /100 | #243 | Tragic 97.6% |
| Bolivians | 1.2 /100 | #244 | Tragic 97.6% |
| South Americans | 1.1 /100 | #245 | Tragic 97.6% |
| Indians (Asian) | 1.0 /100 | #246 | Tragic 97.6% |
| Immigrants | Eastern Africa | 1.0 /100 | #247 | Tragic 97.6% |
| Immigrants | Middle Africa | 1.0 /100 | #248 | Tragic 97.6% |
| Peruvians | 1.0 /100 | #249 | Tragic 97.6% |
| Immigrants | Senegal | 0.9 /100 | #250 | Tragic 97.6% |
| Ethiopians | 0.9 /100 | #251 | Tragic 97.6% |
| Immigrants | Iraq | 0.9 /100 | #252 | Tragic 97.6% |
| Immigrants | Africa | 0.8 /100 | #253 | Tragic 97.6% |
| Immigrants | Asia | 0.8 /100 | #254 | Tragic 97.6% |
| Immigrants | Congo | 0.8 /100 | #255 | Tragic 97.6% |
| Yaqui | 0.7 /100 | #256 | Tragic 97.6% |
| Immigrants | Colombia | 0.6 /100 | #257 | Tragic 97.6% |