Immigrants from Denmark vs White/Caucasian Female Unemployment
COMPARE
Immigrants from Denmark
White/Caucasian
Female Unemployment
Female Unemployment Comparison
Immigrants from Denmark
Whites/Caucasians
5.2%
FEMALE UNEMPLOYMENT
55.0/ 100
METRIC RATING
171st/ 347
METRIC RANK
4.9%
FEMALE UNEMPLOYMENT
99.0/ 100
METRIC RATING
53rd/ 347
METRIC RANK
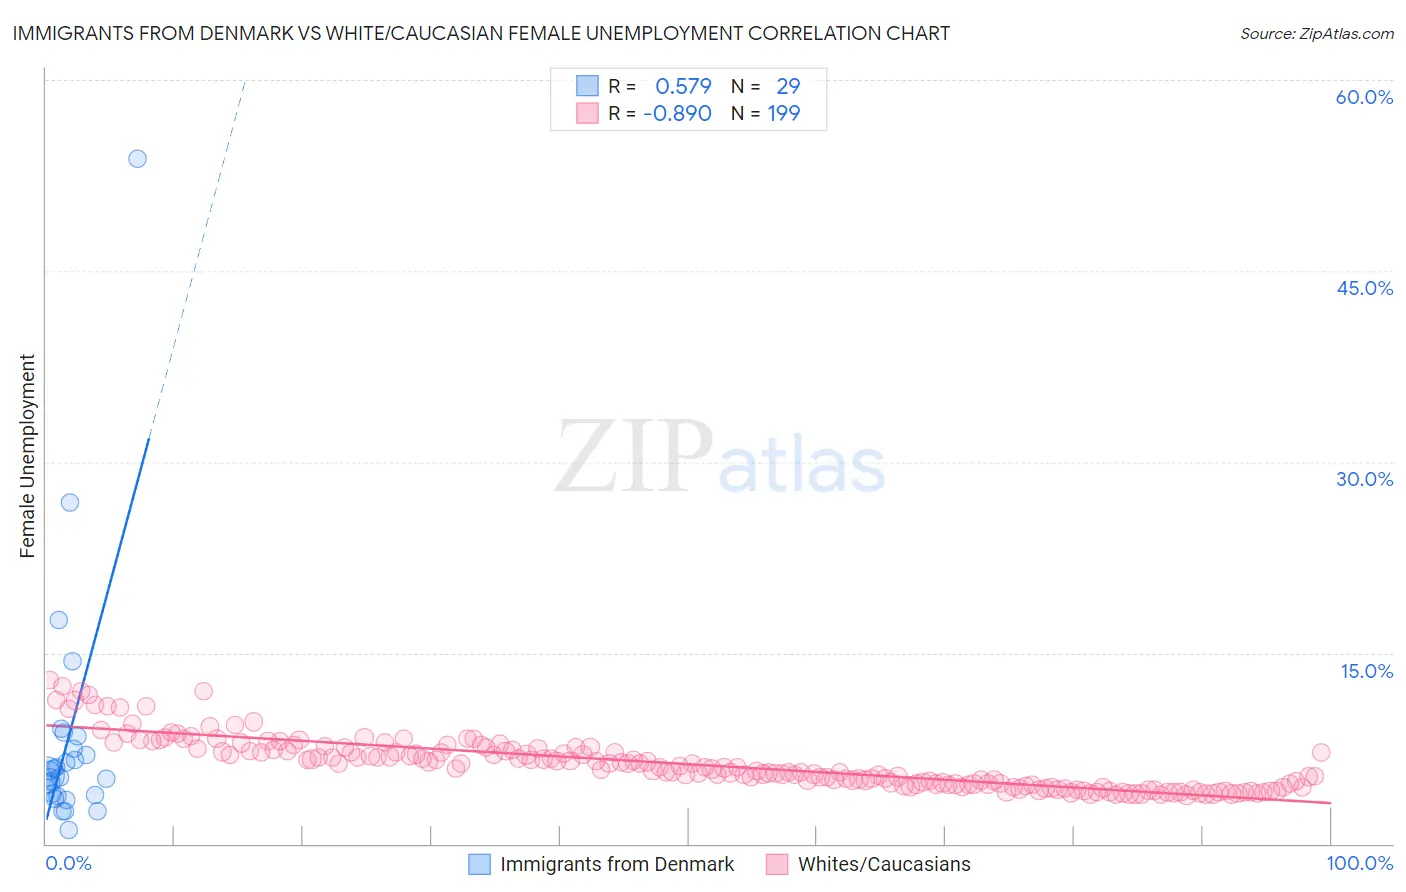
Immigrants from Denmark vs White/Caucasian Female Unemployment Correlation Chart
The statistical analysis conducted on geographies consisting of 136,180,001 people shows a substantial positive correlation between the proportion of Immigrants from Denmark and unemploymnet rate among females in the United States with a correlation coefficient (R) of 0.579 and weighted average of 5.2%. Similarly, the statistical analysis conducted on geographies consisting of 566,814,917 people shows a very strong negative correlation between the proportion of Whites/Caucasians and unemploymnet rate among females in the United States with a correlation coefficient (R) of -0.890 and weighted average of 4.9%, a difference of 7.2%.
Female Unemployment Correlation Summary
| Measurement | Immigrants from Denmark | White/Caucasian |
| Minimum | 1.1% | 3.8% |
| Maximum | 53.8% | 12.8% |
| Range | 52.7% | 9.0% |
| Mean | 8.3% | 6.3% |
| Median | 5.4% | 5.9% |
| Interquartile 25% (IQ1) | 3.8% | 4.7% |
| Interquartile 75% (IQ3) | 8.0% | 7.3% |
| Interquartile Range (IQR) | 4.2% | 2.7% |
| Standard Deviation (Sample) | 10.1% | 2.0% |
| Standard Deviation (Population) | 10.0% | 2.0% |
Similar Demographics by Female Unemployment
Demographics Similar to Immigrants from Denmark by Female Unemployment
In terms of female unemployment, the demographic groups most similar to Immigrants from Denmark are Spanish (5.2%, a difference of 0.050%), Immigrants from Chile (5.2%, a difference of 0.24%), Immigrants from Uganda (5.3%, a difference of 0.26%), Sri Lankan (5.2%, a difference of 0.27%), and Iranian (5.3%, a difference of 0.28%).
| Demographics | Rating | Rank | Female Unemployment |
| Bangladeshis | 64.3 /100 | #164 | Good 5.2% |
| Syrians | 62.8 /100 | #165 | Good 5.2% |
| Native Hawaiians | 62.7 /100 | #166 | Good 5.2% |
| Immigrants | Thailand | 62.1 /100 | #167 | Good 5.2% |
| Sri Lankans | 59.4 /100 | #168 | Average 5.2% |
| Immigrants | Chile | 59.0 /100 | #169 | Average 5.2% |
| Spanish | 55.9 /100 | #170 | Average 5.2% |
| Immigrants | Denmark | 55.0 /100 | #171 | Average 5.2% |
| Immigrants | Uganda | 50.7 /100 | #172 | Average 5.3% |
| Iranians | 50.4 /100 | #173 | Average 5.3% |
| Immigrants | Poland | 50.0 /100 | #174 | Average 5.3% |
| Immigrants | Laos | 47.5 /100 | #175 | Average 5.3% |
| Immigrants | Vietnam | 47.5 /100 | #176 | Average 5.3% |
| Immigrants | Morocco | 47.4 /100 | #177 | Average 5.3% |
| Immigrants | Southern Europe | 46.2 /100 | #178 | Average 5.3% |
Demographics Similar to Whites/Caucasians by Female Unemployment
In terms of female unemployment, the demographic groups most similar to Whites/Caucasians are Slavic (4.9%, a difference of 0.030%), Cambodian (4.9%, a difference of 0.050%), Immigrants from Zimbabwe (4.9%, a difference of 0.060%), Immigrants from Cuba (4.9%, a difference of 0.070%), and Immigrants from Moldova (4.9%, a difference of 0.080%).
| Demographics | Rating | Rank | Female Unemployment |
| Immigrants | Bulgaria | 99.3 /100 | #46 | Exceptional 4.9% |
| Okinawans | 99.3 /100 | #47 | Exceptional 4.9% |
| Thais | 99.2 /100 | #48 | Exceptional 4.9% |
| Australians | 99.2 /100 | #49 | Exceptional 4.9% |
| Immigrants | Cuba | 99.1 /100 | #50 | Exceptional 4.9% |
| Cambodians | 99.1 /100 | #51 | Exceptional 4.9% |
| Slavs | 99.1 /100 | #52 | Exceptional 4.9% |
| Whites/Caucasians | 99.0 /100 | #53 | Exceptional 4.9% |
| Immigrants | Zimbabwe | 99.0 /100 | #54 | Exceptional 4.9% |
| Immigrants | Moldova | 99.0 /100 | #55 | Exceptional 4.9% |
| Serbians | 99.0 /100 | #56 | Exceptional 4.9% |
| Icelanders | 98.8 /100 | #57 | Exceptional 4.9% |
| Immigrants | Lithuania | 98.8 /100 | #58 | Exceptional 4.9% |
| Bhutanese | 98.7 /100 | #59 | Exceptional 4.9% |
| Immigrants | Scotland | 98.6 /100 | #60 | Exceptional 4.9% |