Immigrants from Denmark vs Immigrants from Eastern Asia Female Unemployment
COMPARE
Immigrants from Denmark
Immigrants from Eastern Asia
Female Unemployment
Female Unemployment Comparison
Immigrants from Denmark
Immigrants from Eastern Asia
5.2%
FEMALE UNEMPLOYMENT
55.0/ 100
METRIC RATING
171st/ 347
METRIC RANK
5.1%
FEMALE UNEMPLOYMENT
83.0/ 100
METRIC RATING
139th/ 347
METRIC RANK
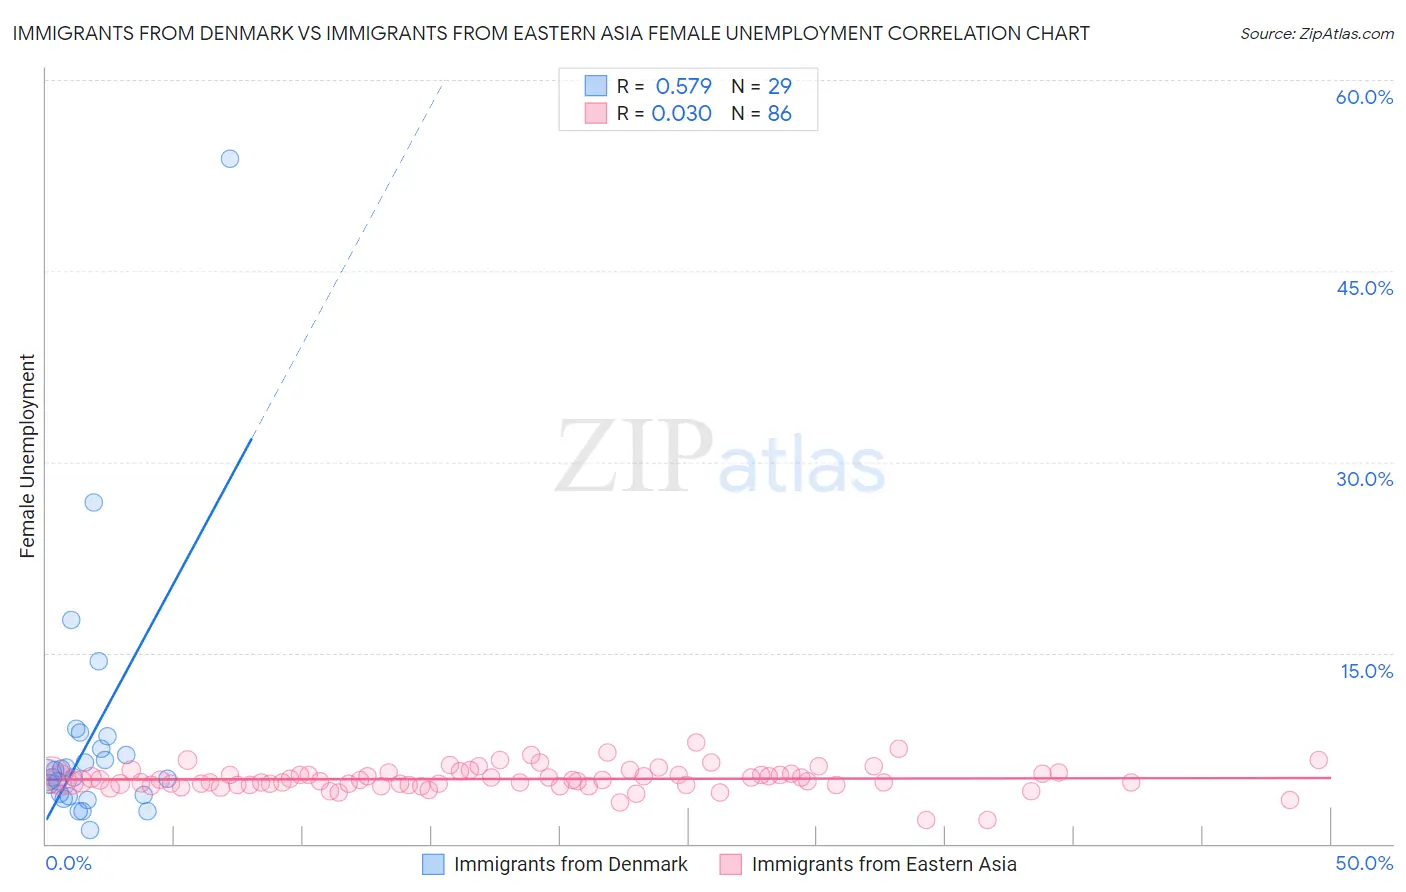
Immigrants from Denmark vs Immigrants from Eastern Asia Female Unemployment Correlation Chart
The statistical analysis conducted on geographies consisting of 136,180,001 people shows a substantial positive correlation between the proportion of Immigrants from Denmark and unemploymnet rate among females in the United States with a correlation coefficient (R) of 0.579 and weighted average of 5.2%. Similarly, the statistical analysis conducted on geographies consisting of 495,373,600 people shows no correlation between the proportion of Immigrants from Eastern Asia and unemploymnet rate among females in the United States with a correlation coefficient (R) of 0.030 and weighted average of 5.1%, a difference of 2.1%.
Female Unemployment Correlation Summary
| Measurement | Immigrants from Denmark | Immigrants from Eastern Asia |
| Minimum | 1.1% | 1.9% |
| Maximum | 53.8% | 8.0% |
| Range | 52.7% | 6.1% |
| Mean | 8.3% | 5.1% |
| Median | 5.4% | 5.0% |
| Interquartile 25% (IQ1) | 3.8% | 4.6% |
| Interquartile 75% (IQ3) | 8.0% | 5.5% |
| Interquartile Range (IQR) | 4.2% | 0.85% |
| Standard Deviation (Sample) | 10.1% | 0.97% |
| Standard Deviation (Population) | 10.0% | 0.96% |
Similar Demographics by Female Unemployment
Demographics Similar to Immigrants from Denmark by Female Unemployment
In terms of female unemployment, the demographic groups most similar to Immigrants from Denmark are Spanish (5.2%, a difference of 0.050%), Immigrants from Chile (5.2%, a difference of 0.24%), Immigrants from Uganda (5.3%, a difference of 0.26%), Sri Lankan (5.2%, a difference of 0.27%), and Iranian (5.3%, a difference of 0.28%).
| Demographics | Rating | Rank | Female Unemployment |
| Bangladeshis | 64.3 /100 | #164 | Good 5.2% |
| Syrians | 62.8 /100 | #165 | Good 5.2% |
| Native Hawaiians | 62.7 /100 | #166 | Good 5.2% |
| Immigrants | Thailand | 62.1 /100 | #167 | Good 5.2% |
| Sri Lankans | 59.4 /100 | #168 | Average 5.2% |
| Immigrants | Chile | 59.0 /100 | #169 | Average 5.2% |
| Spanish | 55.9 /100 | #170 | Average 5.2% |
| Immigrants | Denmark | 55.0 /100 | #171 | Average 5.2% |
| Immigrants | Uganda | 50.7 /100 | #172 | Average 5.3% |
| Iranians | 50.4 /100 | #173 | Average 5.3% |
| Immigrants | Poland | 50.0 /100 | #174 | Average 5.3% |
| Immigrants | Laos | 47.5 /100 | #175 | Average 5.3% |
| Immigrants | Vietnam | 47.5 /100 | #176 | Average 5.3% |
| Immigrants | Morocco | 47.4 /100 | #177 | Average 5.3% |
| Immigrants | Southern Europe | 46.2 /100 | #178 | Average 5.3% |
Demographics Similar to Immigrants from Eastern Asia by Female Unemployment
In terms of female unemployment, the demographic groups most similar to Immigrants from Eastern Asia are Chickasaw (5.1%, a difference of 0.020%), Immigrants from France (5.1%, a difference of 0.040%), Pakistani (5.1%, a difference of 0.080%), Indian (Asian) (5.1%, a difference of 0.13%), and Immigrants from Eastern Europe (5.1%, a difference of 0.16%).
| Demographics | Rating | Rank | Female Unemployment |
| Immigrants | Sri Lanka | 85.0 /100 | #132 | Excellent 5.1% |
| Immigrants | Hong Kong | 84.8 /100 | #133 | Excellent 5.1% |
| Immigrants | Eritrea | 84.6 /100 | #134 | Excellent 5.1% |
| Immigrants | Latvia | 84.6 /100 | #135 | Excellent 5.1% |
| Indians (Asian) | 84.2 /100 | #136 | Excellent 5.1% |
| Pakistanis | 83.8 /100 | #137 | Excellent 5.1% |
| Chickasaw | 83.2 /100 | #138 | Excellent 5.1% |
| Immigrants | Eastern Asia | 83.0 /100 | #139 | Excellent 5.1% |
| Immigrants | France | 82.7 /100 | #140 | Excellent 5.1% |
| Immigrants | Eastern Europe | 81.5 /100 | #141 | Excellent 5.1% |
| Palestinians | 80.8 /100 | #142 | Excellent 5.1% |
| Immigrants | Kazakhstan | 80.7 /100 | #143 | Excellent 5.1% |
| Immigrants | Jordan | 80.4 /100 | #144 | Excellent 5.1% |
| Immigrants | Oceania | 79.5 /100 | #145 | Good 5.2% |
| Immigrants | Norway | 79.4 /100 | #146 | Good 5.2% |