Immigrants from Denmark vs White/Caucasian In Labor Force | Age 20-24
COMPARE
Immigrants from Denmark
White/Caucasian
In Labor Force | Age 20-24
In Labor Force | Age 20-24 Comparison
Immigrants from Denmark
Whites/Caucasians
74.8%
IN LABOR FORCE | AGE 20-24
25.8/ 100
METRIC RATING
194th/ 347
METRIC RANK
76.9%
IN LABOR FORCE | AGE 20-24
99.9/ 100
METRIC RATING
64th/ 347
METRIC RANK
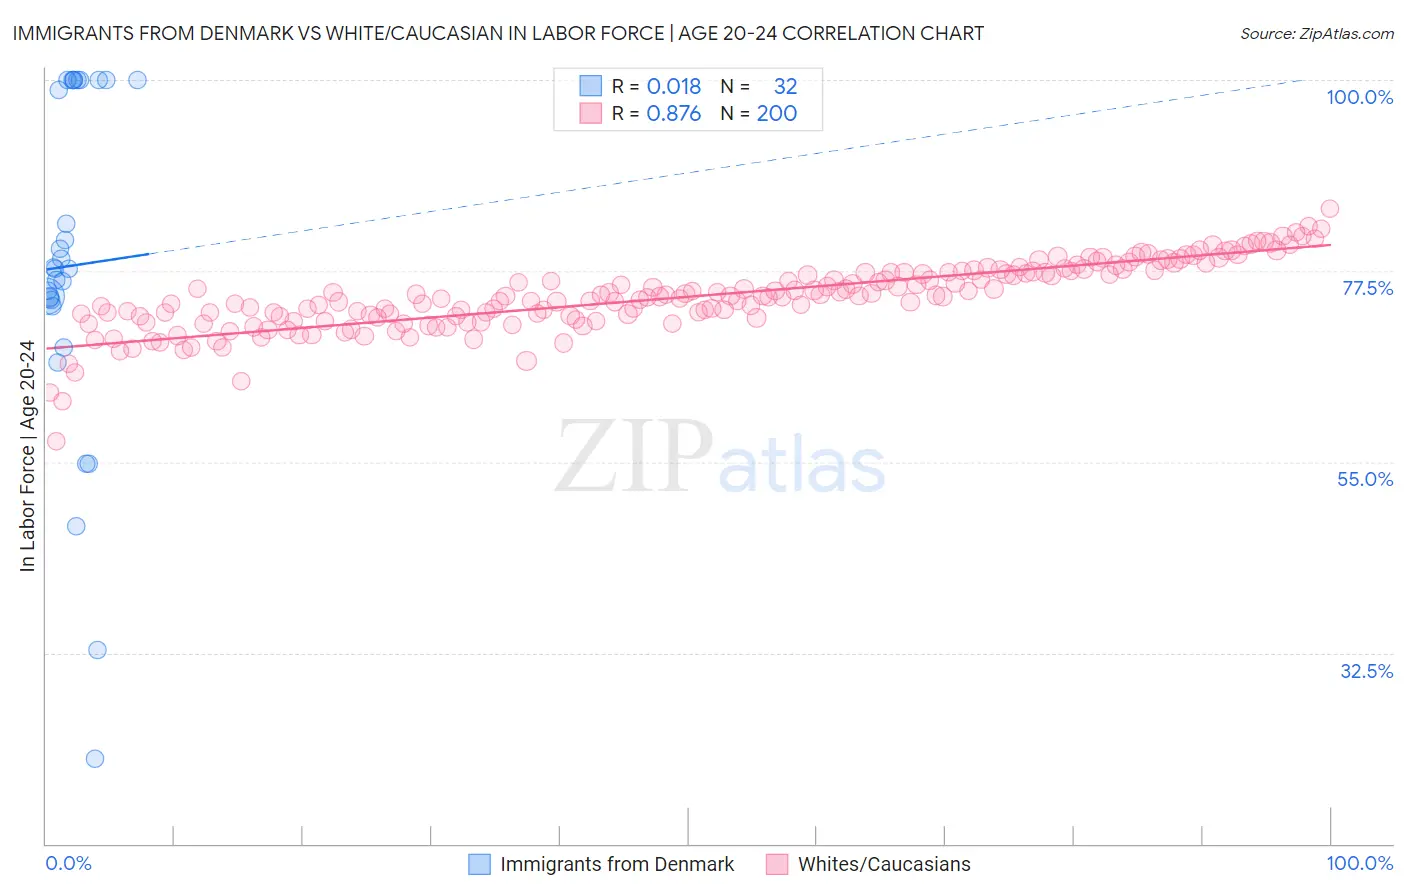
Immigrants from Denmark vs White/Caucasian In Labor Force | Age 20-24 Correlation Chart
The statistical analysis conducted on geographies consisting of 136,401,284 people shows no correlation between the proportion of Immigrants from Denmark and labor force participation rate among population between the ages 20 and 24 in the United States with a correlation coefficient (R) of 0.018 and weighted average of 74.8%. Similarly, the statistical analysis conducted on geographies consisting of 582,226,034 people shows a very strong positive correlation between the proportion of Whites/Caucasians and labor force participation rate among population between the ages 20 and 24 in the United States with a correlation coefficient (R) of 0.876 and weighted average of 76.9%, a difference of 2.9%.
In Labor Force | Age 20-24 Correlation Summary
| Measurement | Immigrants from Denmark | White/Caucasian |
| Minimum | 20.0% | 57.4% |
| Maximum | 100.0% | 84.8% |
| Range | 80.0% | 27.5% |
| Mean | 78.1% | 74.5% |
| Median | 77.7% | 74.5% |
| Interquartile 25% (IQ1) | 73.7% | 72.1% |
| Interquartile 75% (IQ3) | 100.0% | 77.3% |
| Interquartile Range (IQR) | 26.3% | 5.2% |
| Standard Deviation (Sample) | 20.1% | 4.0% |
| Standard Deviation (Population) | 19.8% | 4.0% |
Similar Demographics by In Labor Force | Age 20-24
Demographics Similar to Immigrants from Denmark by In Labor Force | Age 20-24
In terms of in labor force | age 20-24, the demographic groups most similar to Immigrants from Denmark are Eastern European (74.8%, a difference of 0.010%), Immigrants from Vietnam (74.7%, a difference of 0.010%), Panamanian (74.7%, a difference of 0.010%), Immigrants from Europe (74.8%, a difference of 0.030%), and Alsatian (74.8%, a difference of 0.030%).
| Demographics | Rating | Rank | In Labor Force | Age 20-24 |
| Immigrants | Honduras | 33.5 /100 | #187 | Fair 74.9% |
| Hondurans | 32.7 /100 | #188 | Fair 74.8% |
| Immigrants | Northern Europe | 32.6 /100 | #189 | Fair 74.8% |
| Russians | 32.2 /100 | #190 | Fair 74.8% |
| Senegalese | 28.1 /100 | #191 | Fair 74.8% |
| Immigrants | Europe | 27.5 /100 | #192 | Fair 74.8% |
| Alsatians | 27.1 /100 | #193 | Fair 74.8% |
| Immigrants | Denmark | 25.8 /100 | #194 | Fair 74.8% |
| Eastern Europeans | 25.4 /100 | #195 | Fair 74.8% |
| Immigrants | Vietnam | 25.1 /100 | #196 | Fair 74.7% |
| Panamanians | 25.0 /100 | #197 | Fair 74.7% |
| Immigrants | Nigeria | 24.2 /100 | #198 | Fair 74.7% |
| Taiwanese | 23.2 /100 | #199 | Fair 74.7% |
| Nigerians | 21.9 /100 | #200 | Fair 74.7% |
| Choctaw | 21.4 /100 | #201 | Fair 74.7% |
Demographics Similar to Whites/Caucasians by In Labor Force | Age 20-24
In terms of in labor force | age 20-24, the demographic groups most similar to Whites/Caucasians are Immigrants from Kenya (77.0%, a difference of 0.040%), Lithuanian (77.0%, a difference of 0.040%), Immigrants from Eritrea (77.0%, a difference of 0.050%), Crow (76.9%, a difference of 0.050%), and Icelander (76.9%, a difference of 0.070%).
| Demographics | Rating | Rank | In Labor Force | Age 20-24 |
| Chippewa | 99.9 /100 | #57 | Exceptional 77.1% |
| Hawaiians | 99.9 /100 | #58 | Exceptional 77.0% |
| Scotch-Irish | 99.9 /100 | #59 | Exceptional 77.0% |
| Kenyans | 99.9 /100 | #60 | Exceptional 77.0% |
| Immigrants | Eritrea | 99.9 /100 | #61 | Exceptional 77.0% |
| Immigrants | Kenya | 99.9 /100 | #62 | Exceptional 77.0% |
| Lithuanians | 99.9 /100 | #63 | Exceptional 77.0% |
| Whites/Caucasians | 99.9 /100 | #64 | Exceptional 76.9% |
| Crow | 99.9 /100 | #65 | Exceptional 76.9% |
| Icelanders | 99.9 /100 | #66 | Exceptional 76.9% |
| Slavs | 99.9 /100 | #67 | Exceptional 76.9% |
| French American Indians | 99.8 /100 | #68 | Exceptional 76.8% |
| Immigrants | Sudan | 99.8 /100 | #69 | Exceptional 76.8% |
| Ottawa | 99.8 /100 | #70 | Exceptional 76.8% |
| Northern Europeans | 99.8 /100 | #71 | Exceptional 76.8% |