Bulgarian vs White/Caucasian Female Unemployment
COMPARE
Bulgarian
White/Caucasian
Female Unemployment
Female Unemployment Comparison
Bulgarians
Whites/Caucasians
4.7%
FEMALE UNEMPLOYMENT
99.9/ 100
METRIC RATING
20th/ 347
METRIC RANK
4.9%
FEMALE UNEMPLOYMENT
99.0/ 100
METRIC RATING
53rd/ 347
METRIC RANK
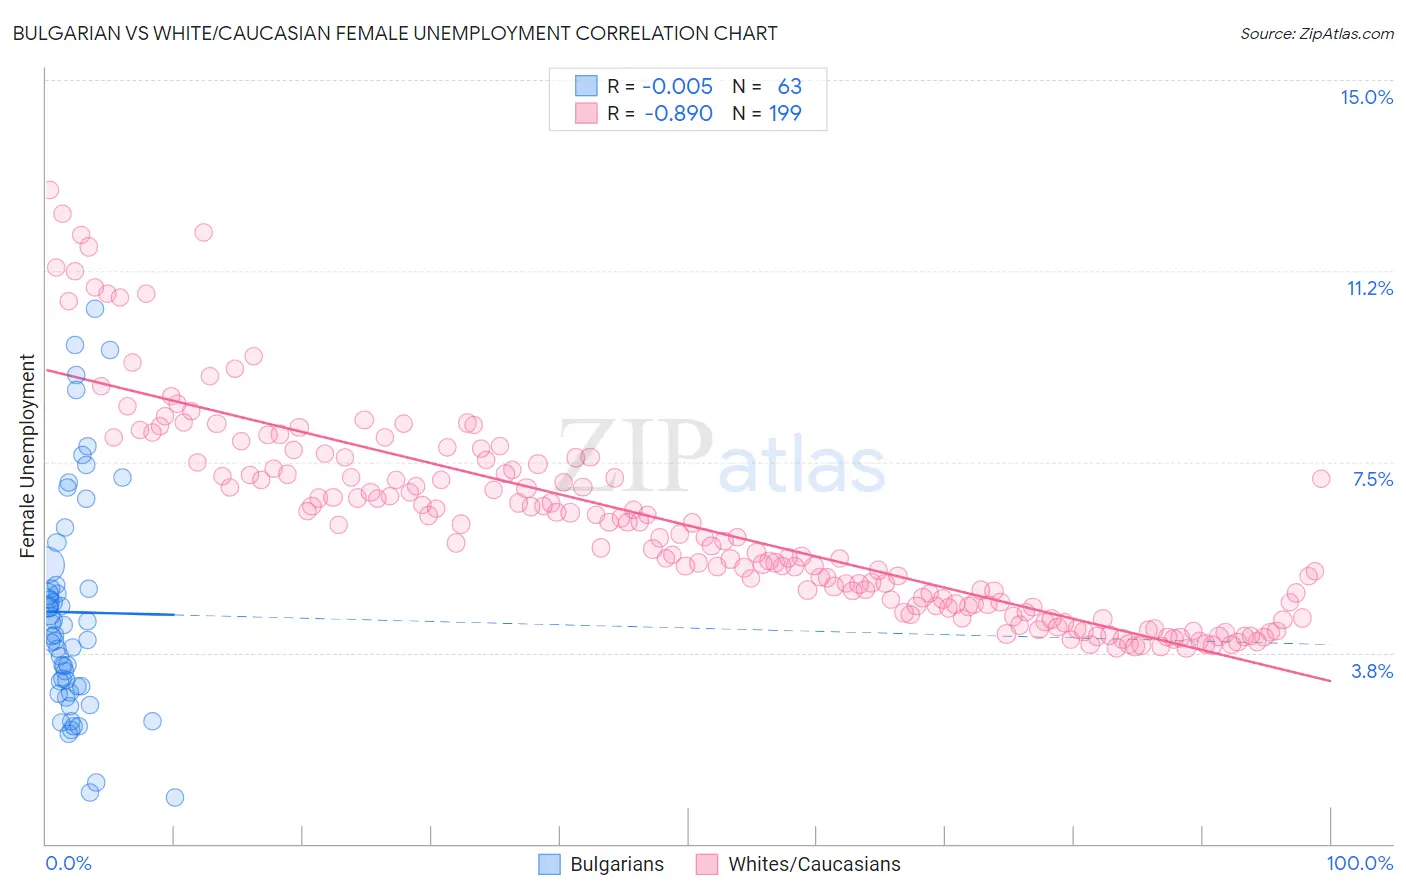
Bulgarian vs White/Caucasian Female Unemployment Correlation Chart
The statistical analysis conducted on geographies consisting of 205,222,328 people shows no correlation between the proportion of Bulgarians and unemploymnet rate among females in the United States with a correlation coefficient (R) of -0.005 and weighted average of 4.7%. Similarly, the statistical analysis conducted on geographies consisting of 566,814,917 people shows a very strong negative correlation between the proportion of Whites/Caucasians and unemploymnet rate among females in the United States with a correlation coefficient (R) of -0.890 and weighted average of 4.9%, a difference of 4.4%.
Female Unemployment Correlation Summary
| Measurement | Bulgarian | White/Caucasian |
| Minimum | 0.90% | 3.8% |
| Maximum | 10.5% | 12.8% |
| Range | 9.6% | 9.0% |
| Mean | 4.5% | 6.3% |
| Median | 4.1% | 5.9% |
| Interquartile 25% (IQ1) | 3.1% | 4.7% |
| Interquartile 75% (IQ3) | 5.1% | 7.3% |
| Interquartile Range (IQR) | 2.0% | 2.7% |
| Standard Deviation (Sample) | 2.2% | 2.0% |
| Standard Deviation (Population) | 2.2% | 2.0% |
Similar Demographics by Female Unemployment
Demographics Similar to Bulgarians by Female Unemployment
In terms of female unemployment, the demographic groups most similar to Bulgarians are Fijian (4.7%, a difference of 0.010%), European (4.7%, a difference of 0.030%), Polish (4.7%, a difference of 0.080%), Latvian (4.7%, a difference of 0.090%), and Croatian (4.7%, a difference of 0.24%).
| Demographics | Rating | Rank | Female Unemployment |
| Belgians | 100.0 /100 | #13 | Exceptional 4.6% |
| Finns | 100.0 /100 | #14 | Exceptional 4.6% |
| English | 100.0 /100 | #15 | Exceptional 4.6% |
| Carpatho Rusyns | 99.9 /100 | #16 | Exceptional 4.7% |
| Croatians | 99.9 /100 | #17 | Exceptional 4.7% |
| Latvians | 99.9 /100 | #18 | Exceptional 4.7% |
| Poles | 99.9 /100 | #19 | Exceptional 4.7% |
| Bulgarians | 99.9 /100 | #20 | Exceptional 4.7% |
| Fijians | 99.9 /100 | #21 | Exceptional 4.7% |
| Europeans | 99.9 /100 | #22 | Exceptional 4.7% |
| Scottish | 99.9 /100 | #23 | Exceptional 4.7% |
| Welsh | 99.9 /100 | #24 | Exceptional 4.7% |
| Immigrants | India | 99.9 /100 | #25 | Exceptional 4.7% |
| Immigrants | Bosnia and Herzegovina | 99.9 /100 | #26 | Exceptional 4.7% |
| British | 99.9 /100 | #27 | Exceptional 4.7% |
Demographics Similar to Whites/Caucasians by Female Unemployment
In terms of female unemployment, the demographic groups most similar to Whites/Caucasians are Slavic (4.9%, a difference of 0.030%), Cambodian (4.9%, a difference of 0.050%), Immigrants from Zimbabwe (4.9%, a difference of 0.060%), Immigrants from Cuba (4.9%, a difference of 0.070%), and Immigrants from Moldova (4.9%, a difference of 0.080%).
| Demographics | Rating | Rank | Female Unemployment |
| Immigrants | Bulgaria | 99.3 /100 | #46 | Exceptional 4.9% |
| Okinawans | 99.3 /100 | #47 | Exceptional 4.9% |
| Thais | 99.2 /100 | #48 | Exceptional 4.9% |
| Australians | 99.2 /100 | #49 | Exceptional 4.9% |
| Immigrants | Cuba | 99.1 /100 | #50 | Exceptional 4.9% |
| Cambodians | 99.1 /100 | #51 | Exceptional 4.9% |
| Slavs | 99.1 /100 | #52 | Exceptional 4.9% |
| Whites/Caucasians | 99.0 /100 | #53 | Exceptional 4.9% |
| Immigrants | Zimbabwe | 99.0 /100 | #54 | Exceptional 4.9% |
| Immigrants | Moldova | 99.0 /100 | #55 | Exceptional 4.9% |
| Serbians | 99.0 /100 | #56 | Exceptional 4.9% |
| Icelanders | 98.8 /100 | #57 | Exceptional 4.9% |
| Immigrants | Lithuania | 98.8 /100 | #58 | Exceptional 4.9% |
| Bhutanese | 98.7 /100 | #59 | Exceptional 4.9% |
| Immigrants | Scotland | 98.6 /100 | #60 | Exceptional 4.9% |