Immigrants from Cameroon vs White/Caucasian Female Unemployment
COMPARE
Immigrants from Cameroon
White/Caucasian
Female Unemployment
Female Unemployment Comparison
Immigrants from Cameroon
Whites/Caucasians
5.7%
FEMALE UNEMPLOYMENT
0.6/ 100
METRIC RATING
255th/ 347
METRIC RANK
4.9%
FEMALE UNEMPLOYMENT
99.0/ 100
METRIC RATING
53rd/ 347
METRIC RANK
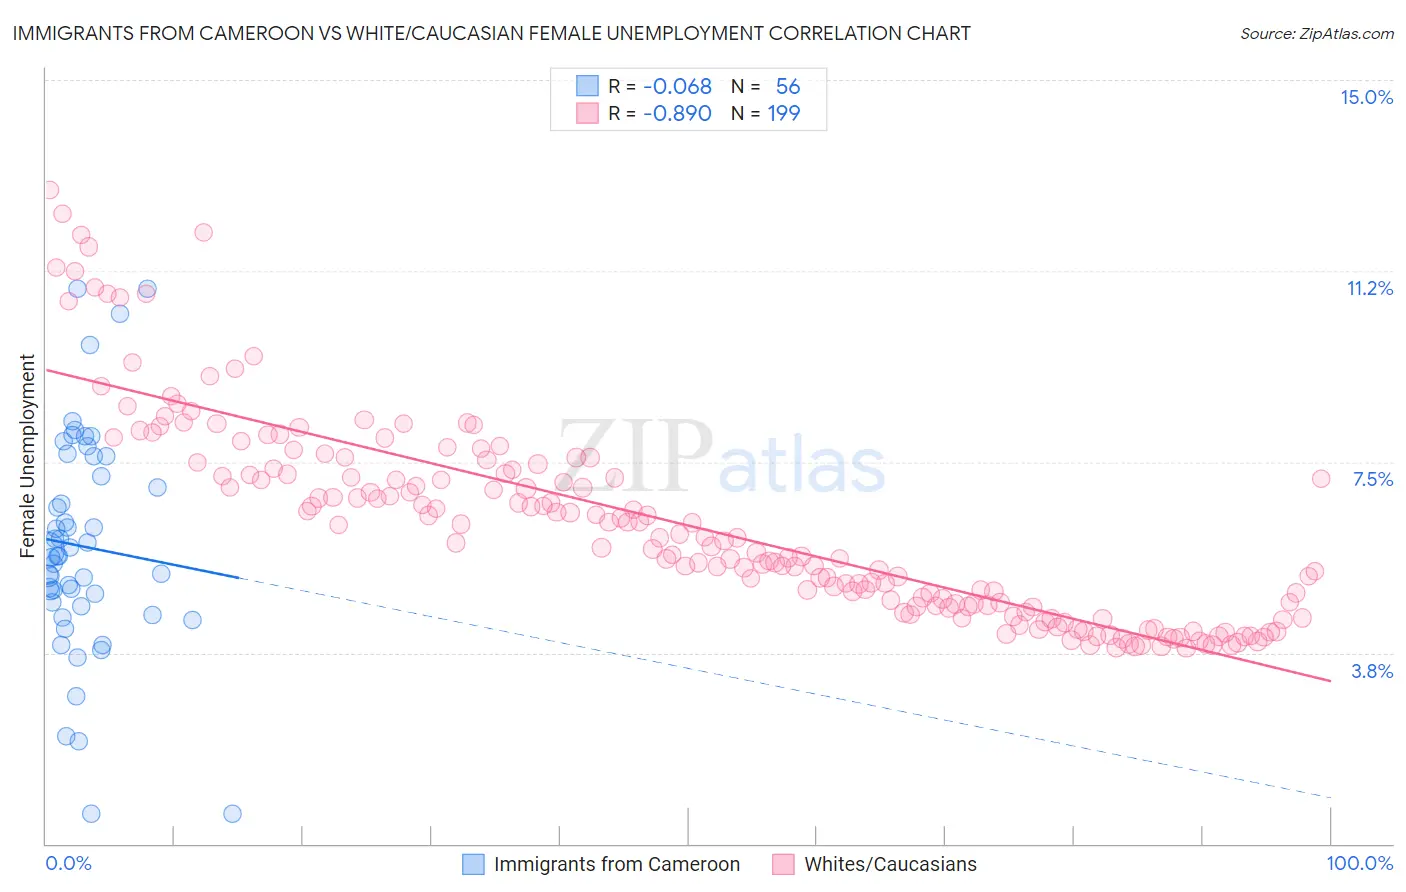
Immigrants from Cameroon vs White/Caucasian Female Unemployment Correlation Chart
The statistical analysis conducted on geographies consisting of 130,670,157 people shows a slight negative correlation between the proportion of Immigrants from Cameroon and unemploymnet rate among females in the United States with a correlation coefficient (R) of -0.068 and weighted average of 5.7%. Similarly, the statistical analysis conducted on geographies consisting of 566,814,917 people shows a very strong negative correlation between the proportion of Whites/Caucasians and unemploymnet rate among females in the United States with a correlation coefficient (R) of -0.890 and weighted average of 4.9%, a difference of 15.8%.
Female Unemployment Correlation Summary
| Measurement | Immigrants from Cameroon | White/Caucasian |
| Minimum | 0.60% | 3.8% |
| Maximum | 10.9% | 12.8% |
| Range | 10.3% | 9.0% |
| Mean | 5.8% | 6.3% |
| Median | 5.6% | 5.9% |
| Interquartile 25% (IQ1) | 4.7% | 4.7% |
| Interquartile 75% (IQ3) | 7.4% | 7.3% |
| Interquartile Range (IQR) | 2.7% | 2.7% |
| Standard Deviation (Sample) | 2.2% | 2.0% |
| Standard Deviation (Population) | 2.2% | 2.0% |
Similar Demographics by Female Unemployment
Demographics Similar to Immigrants from Cameroon by Female Unemployment
In terms of female unemployment, the demographic groups most similar to Immigrants from Cameroon are Immigrants from Sierra Leone (5.7%, a difference of 0.040%), Immigrants (5.7%, a difference of 0.040%), Cajun (5.7%, a difference of 0.18%), Assyrian/Chaldean/Syriac (5.6%, a difference of 0.38%), and Immigrants from Syria (5.6%, a difference of 0.44%).
| Demographics | Rating | Rank | Female Unemployment |
| Cree | 1.0 /100 | #248 | Tragic 5.6% |
| Immigrants | Uzbekistan | 1.0 /100 | #249 | Tragic 5.6% |
| Immigrants | Syria | 0.8 /100 | #250 | Tragic 5.6% |
| Assyrians/Chaldeans/Syriacs | 0.8 /100 | #251 | Tragic 5.6% |
| Cajuns | 0.7 /100 | #252 | Tragic 5.7% |
| Immigrants | Sierra Leone | 0.6 /100 | #253 | Tragic 5.7% |
| Immigrants | Immigrants | 0.6 /100 | #254 | Tragic 5.7% |
| Immigrants | Cameroon | 0.6 /100 | #255 | Tragic 5.7% |
| Sub-Saharan Africans | 0.4 /100 | #256 | Tragic 5.7% |
| Dutch West Indians | 0.3 /100 | #257 | Tragic 5.7% |
| Immigrants | Portugal | 0.2 /100 | #258 | Tragic 5.8% |
| Immigrants | Fiji | 0.2 /100 | #259 | Tragic 5.8% |
| Nigerians | 0.2 /100 | #260 | Tragic 5.8% |
| Kiowa | 0.1 /100 | #261 | Tragic 5.8% |
| Immigrants | Nigeria | 0.1 /100 | #262 | Tragic 5.8% |
Demographics Similar to Whites/Caucasians by Female Unemployment
In terms of female unemployment, the demographic groups most similar to Whites/Caucasians are Slavic (4.9%, a difference of 0.030%), Cambodian (4.9%, a difference of 0.050%), Immigrants from Zimbabwe (4.9%, a difference of 0.060%), Immigrants from Cuba (4.9%, a difference of 0.070%), and Immigrants from Moldova (4.9%, a difference of 0.080%).
| Demographics | Rating | Rank | Female Unemployment |
| Immigrants | Bulgaria | 99.3 /100 | #46 | Exceptional 4.9% |
| Okinawans | 99.3 /100 | #47 | Exceptional 4.9% |
| Thais | 99.2 /100 | #48 | Exceptional 4.9% |
| Australians | 99.2 /100 | #49 | Exceptional 4.9% |
| Immigrants | Cuba | 99.1 /100 | #50 | Exceptional 4.9% |
| Cambodians | 99.1 /100 | #51 | Exceptional 4.9% |
| Slavs | 99.1 /100 | #52 | Exceptional 4.9% |
| Whites/Caucasians | 99.0 /100 | #53 | Exceptional 4.9% |
| Immigrants | Zimbabwe | 99.0 /100 | #54 | Exceptional 4.9% |
| Immigrants | Moldova | 99.0 /100 | #55 | Exceptional 4.9% |
| Serbians | 99.0 /100 | #56 | Exceptional 4.9% |
| Icelanders | 98.8 /100 | #57 | Exceptional 4.9% |
| Immigrants | Lithuania | 98.8 /100 | #58 | Exceptional 4.9% |
| Bhutanese | 98.7 /100 | #59 | Exceptional 4.9% |
| Immigrants | Scotland | 98.6 /100 | #60 | Exceptional 4.9% |