Immigrants from Denmark vs Chilean Female Unemployment
COMPARE
Immigrants from Denmark
Chilean
Female Unemployment
Female Unemployment Comparison
Immigrants from Denmark
Chileans
5.2%
FEMALE UNEMPLOYMENT
55.0/ 100
METRIC RATING
171st/ 347
METRIC RANK
5.1%
FEMALE UNEMPLOYMENT
85.8/ 100
METRIC RATING
128th/ 347
METRIC RANK
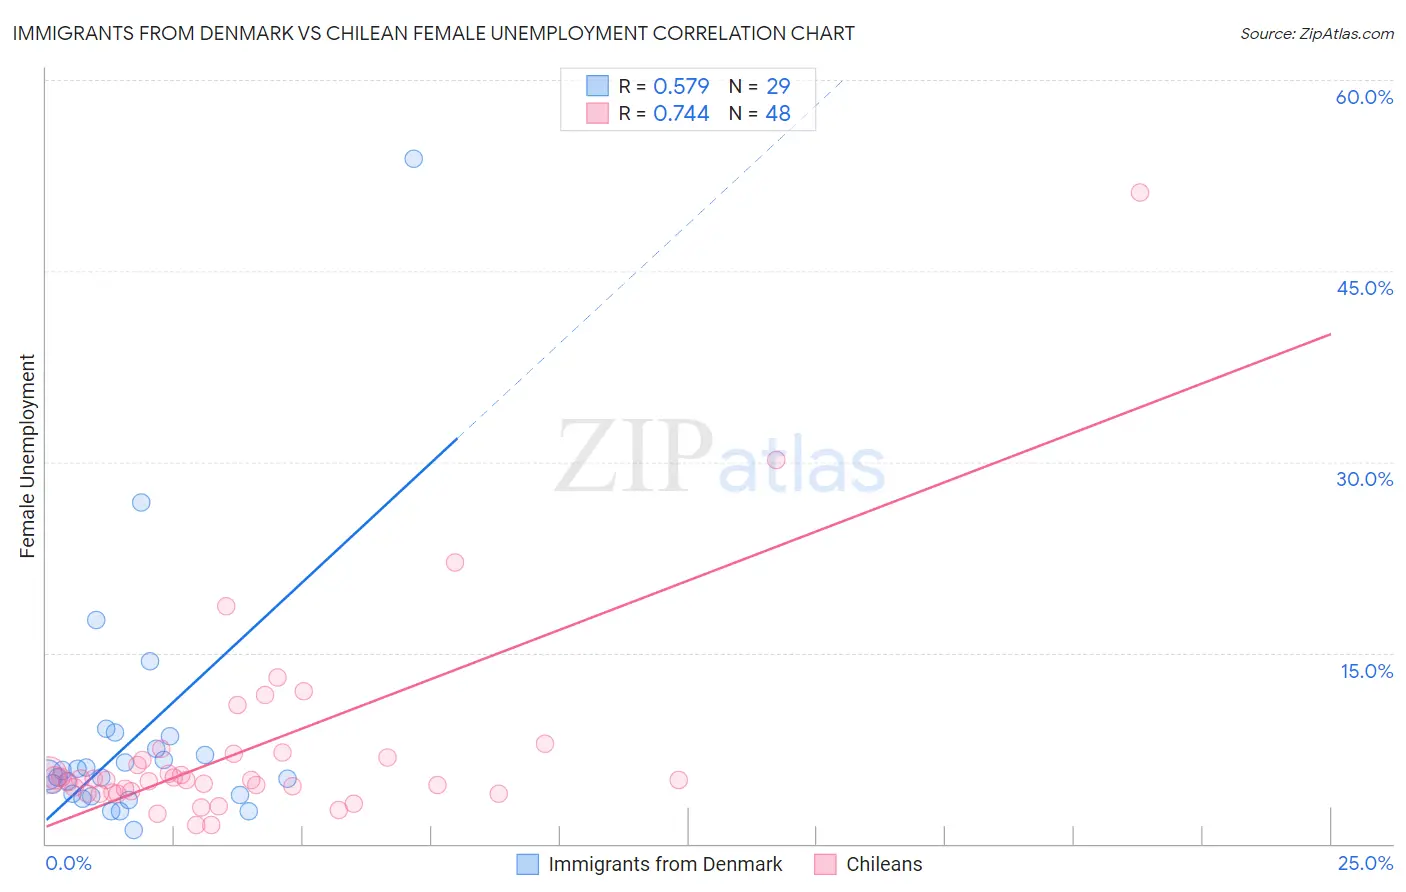
Immigrants from Denmark vs Chilean Female Unemployment Correlation Chart
The statistical analysis conducted on geographies consisting of 136,180,001 people shows a substantial positive correlation between the proportion of Immigrants from Denmark and unemploymnet rate among females in the United States with a correlation coefficient (R) of 0.579 and weighted average of 5.2%. Similarly, the statistical analysis conducted on geographies consisting of 256,253,866 people shows a strong positive correlation between the proportion of Chileans and unemploymnet rate among females in the United States with a correlation coefficient (R) of 0.744 and weighted average of 5.1%, a difference of 2.5%.
Female Unemployment Correlation Summary
| Measurement | Immigrants from Denmark | Chilean |
| Minimum | 1.1% | 1.5% |
| Maximum | 53.8% | 51.2% |
| Range | 52.7% | 49.7% |
| Mean | 8.3% | 7.5% |
| Median | 5.4% | 5.0% |
| Interquartile 25% (IQ1) | 3.8% | 4.1% |
| Interquartile 75% (IQ3) | 8.0% | 6.9% |
| Interquartile Range (IQR) | 4.2% | 2.8% |
| Standard Deviation (Sample) | 10.1% | 8.3% |
| Standard Deviation (Population) | 10.0% | 8.2% |
Similar Demographics by Female Unemployment
Demographics Similar to Immigrants from Denmark by Female Unemployment
In terms of female unemployment, the demographic groups most similar to Immigrants from Denmark are Spanish (5.2%, a difference of 0.050%), Immigrants from Chile (5.2%, a difference of 0.24%), Immigrants from Uganda (5.3%, a difference of 0.26%), Sri Lankan (5.2%, a difference of 0.27%), and Iranian (5.3%, a difference of 0.28%).
| Demographics | Rating | Rank | Female Unemployment |
| Bangladeshis | 64.3 /100 | #164 | Good 5.2% |
| Syrians | 62.8 /100 | #165 | Good 5.2% |
| Native Hawaiians | 62.7 /100 | #166 | Good 5.2% |
| Immigrants | Thailand | 62.1 /100 | #167 | Good 5.2% |
| Sri Lankans | 59.4 /100 | #168 | Average 5.2% |
| Immigrants | Chile | 59.0 /100 | #169 | Average 5.2% |
| Spanish | 55.9 /100 | #170 | Average 5.2% |
| Immigrants | Denmark | 55.0 /100 | #171 | Average 5.2% |
| Immigrants | Uganda | 50.7 /100 | #172 | Average 5.3% |
| Iranians | 50.4 /100 | #173 | Average 5.3% |
| Immigrants | Poland | 50.0 /100 | #174 | Average 5.3% |
| Immigrants | Laos | 47.5 /100 | #175 | Average 5.3% |
| Immigrants | Vietnam | 47.5 /100 | #176 | Average 5.3% |
| Immigrants | Morocco | 47.4 /100 | #177 | Average 5.3% |
| Immigrants | Southern Europe | 46.2 /100 | #178 | Average 5.3% |
Demographics Similar to Chileans by Female Unemployment
In terms of female unemployment, the demographic groups most similar to Chileans are Ethiopian (5.1%, a difference of 0.010%), Immigrants from Hungary (5.1%, a difference of 0.030%), Maltese (5.1%, a difference of 0.040%), Immigrants from Ethiopia (5.1%, a difference of 0.060%), and Immigrants from Korea (5.1%, a difference of 0.070%).
| Demographics | Rating | Rank | Female Unemployment |
| Immigrants | Western Europe | 88.1 /100 | #121 | Excellent 5.1% |
| Immigrants | Germany | 87.6 /100 | #122 | Excellent 5.1% |
| Immigrants | South Africa | 87.6 /100 | #123 | Excellent 5.1% |
| Immigrants | Europe | 87.2 /100 | #124 | Excellent 5.1% |
| Basques | 86.5 /100 | #125 | Excellent 5.1% |
| Immigrants | Korea | 86.3 /100 | #126 | Excellent 5.1% |
| Immigrants | Hungary | 86.0 /100 | #127 | Excellent 5.1% |
| Chileans | 85.8 /100 | #128 | Excellent 5.1% |
| Ethiopians | 85.7 /100 | #129 | Excellent 5.1% |
| Maltese | 85.5 /100 | #130 | Excellent 5.1% |
| Immigrants | Ethiopia | 85.4 /100 | #131 | Excellent 5.1% |
| Immigrants | Sri Lanka | 85.0 /100 | #132 | Excellent 5.1% |
| Immigrants | Hong Kong | 84.8 /100 | #133 | Excellent 5.1% |
| Immigrants | Eritrea | 84.6 /100 | #134 | Excellent 5.1% |
| Immigrants | Latvia | 84.6 /100 | #135 | Excellent 5.1% |