Immigrants from Denmark vs Immigrants from Spain Female Unemployment
COMPARE
Immigrants from Denmark
Immigrants from Spain
Female Unemployment
Female Unemployment Comparison
Immigrants from Denmark
Immigrants from Spain
5.2%
FEMALE UNEMPLOYMENT
55.0/ 100
METRIC RATING
171st/ 347
METRIC RANK
5.2%
FEMALE UNEMPLOYMENT
66.8/ 100
METRIC RATING
160th/ 347
METRIC RANK
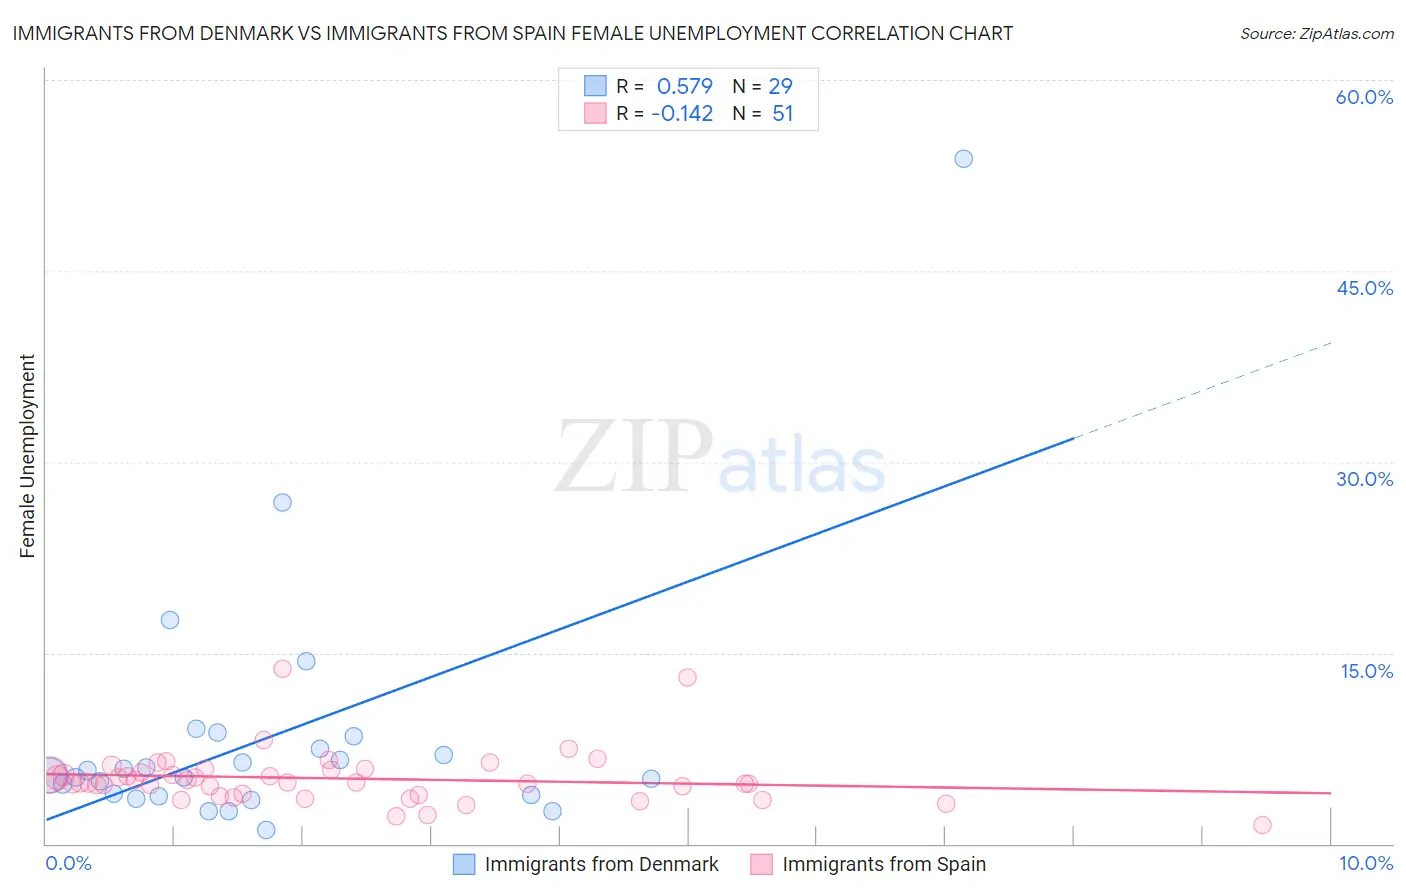
Immigrants from Denmark vs Immigrants from Spain Female Unemployment Correlation Chart
The statistical analysis conducted on geographies consisting of 136,180,001 people shows a substantial positive correlation between the proportion of Immigrants from Denmark and unemploymnet rate among females in the United States with a correlation coefficient (R) of 0.579 and weighted average of 5.2%. Similarly, the statistical analysis conducted on geographies consisting of 239,203,477 people shows a poor negative correlation between the proportion of Immigrants from Spain and unemploymnet rate among females in the United States with a correlation coefficient (R) of -0.142 and weighted average of 5.2%, a difference of 0.75%.
Female Unemployment Correlation Summary
| Measurement | Immigrants from Denmark | Immigrants from Spain |
| Minimum | 1.1% | 1.5% |
| Maximum | 53.8% | 13.8% |
| Range | 52.7% | 12.3% |
| Mean | 8.3% | 5.1% |
| Median | 5.4% | 4.8% |
| Interquartile 25% (IQ1) | 3.8% | 3.8% |
| Interquartile 75% (IQ3) | 8.0% | 5.8% |
| Interquartile Range (IQR) | 4.2% | 2.0% |
| Standard Deviation (Sample) | 10.1% | 2.1% |
| Standard Deviation (Population) | 10.0% | 2.1% |
Demographics Similar to Immigrants from Denmark and Immigrants from Spain by Female Unemployment
In terms of female unemployment, the demographic groups most similar to Immigrants from Denmark are Spanish (5.2%, a difference of 0.050%), Immigrants from Chile (5.2%, a difference of 0.24%), Immigrants from Uganda (5.3%, a difference of 0.26%), Sri Lankan (5.2%, a difference of 0.27%), and Iranian (5.3%, a difference of 0.28%). Similarly, the demographic groups most similar to Immigrants from Spain are Immigrants from Pakistan (5.2%, a difference of 0.0%), Immigrants from Micronesia (5.2%, a difference of 0.010%), Potawatomi (5.2%, a difference of 0.060%), Albanian (5.2%, a difference of 0.11%), and Immigrants from Asia (5.2%, a difference of 0.17%).
| Demographics | Rating | Rank | Female Unemployment |
| Immigrants | Egypt | 70.0 /100 | #155 | Good 5.2% |
| Immigrants | Northern Africa | 69.6 /100 | #156 | Good 5.2% |
| Immigrants | Russia | 69.3 /100 | #157 | Good 5.2% |
| Albanians | 68.3 /100 | #158 | Good 5.2% |
| Immigrants | Micronesia | 66.9 /100 | #159 | Good 5.2% |
| Immigrants | Spain | 66.8 /100 | #160 | Good 5.2% |
| Immigrants | Pakistan | 66.7 /100 | #161 | Good 5.2% |
| Potawatomi | 65.9 /100 | #162 | Good 5.2% |
| Immigrants | Asia | 64.3 /100 | #163 | Good 5.2% |
| Bangladeshis | 64.3 /100 | #164 | Good 5.2% |
| Syrians | 62.8 /100 | #165 | Good 5.2% |
| Native Hawaiians | 62.7 /100 | #166 | Good 5.2% |
| Immigrants | Thailand | 62.1 /100 | #167 | Good 5.2% |
| Sri Lankans | 59.4 /100 | #168 | Average 5.2% |
| Immigrants | Chile | 59.0 /100 | #169 | Average 5.2% |
| Spanish | 55.9 /100 | #170 | Average 5.2% |
| Immigrants | Denmark | 55.0 /100 | #171 | Average 5.2% |
| Immigrants | Uganda | 50.7 /100 | #172 | Average 5.3% |
| Iranians | 50.4 /100 | #173 | Average 5.3% |
| Immigrants | Poland | 50.0 /100 | #174 | Average 5.3% |
| Immigrants | Laos | 47.5 /100 | #175 | Average 5.3% |