Immigrants from Cuba vs Immigrants from Sweden Male Unemployment
COMPARE
Immigrants from Cuba
Immigrants from Sweden
Male Unemployment
Male Unemployment Comparison
Immigrants from Cuba
Immigrants from Sweden
4.4%
MALE UNEMPLOYMENT
100.0/ 100
METRIC RATING
2nd/ 347
METRIC RANK
5.0%
MALE UNEMPLOYMENT
97.4/ 100
METRIC RATING
69th/ 347
METRIC RANK
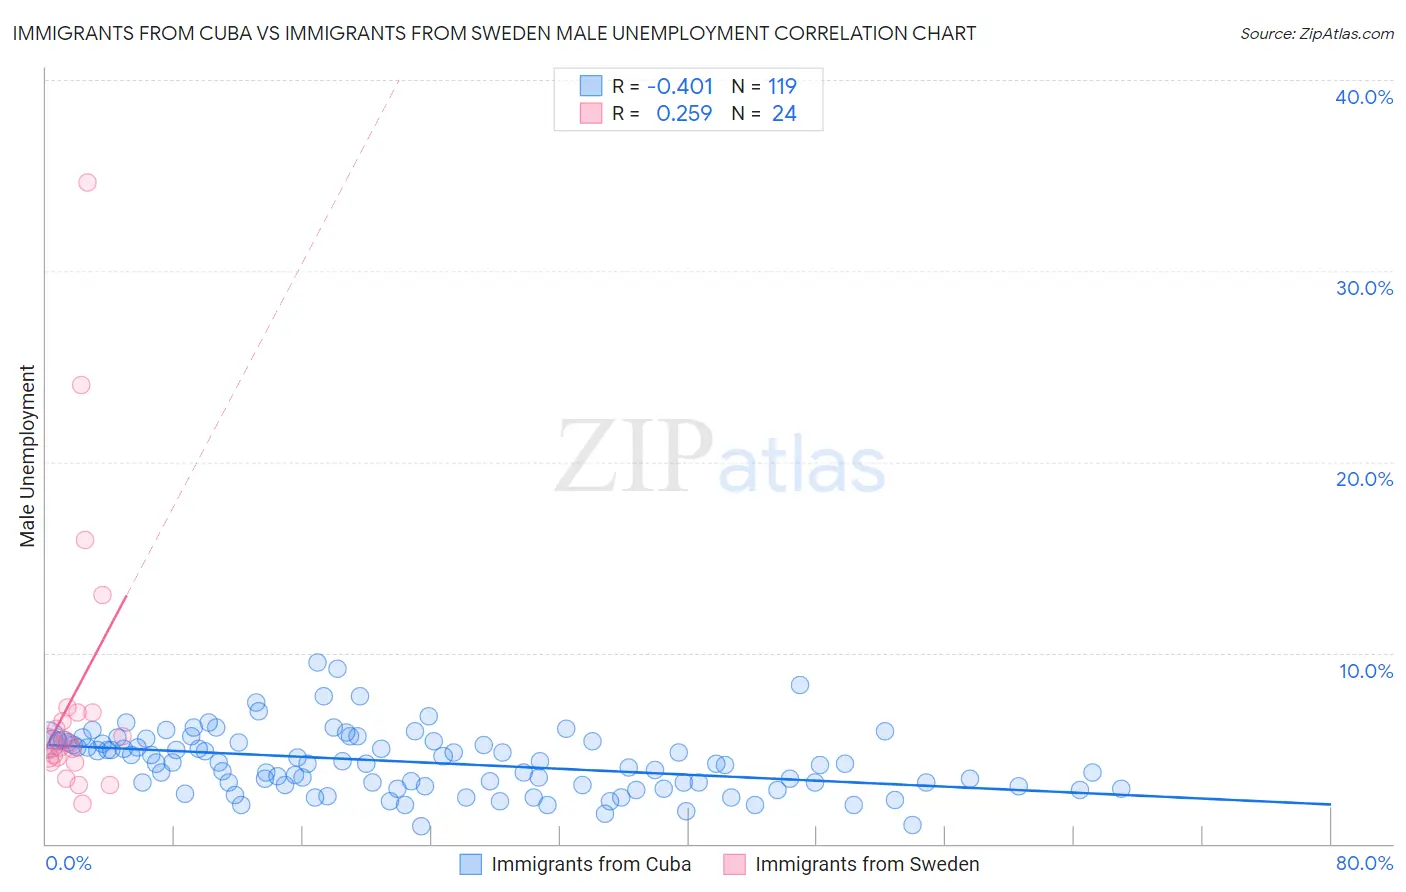
Immigrants from Cuba vs Immigrants from Sweden Male Unemployment Correlation Chart
The statistical analysis conducted on geographies consisting of 325,045,859 people shows a moderate negative correlation between the proportion of Immigrants from Cuba and unemployment rate among males in the United States with a correlation coefficient (R) of -0.401 and weighted average of 4.4%. Similarly, the statistical analysis conducted on geographies consisting of 164,513,093 people shows a weak positive correlation between the proportion of Immigrants from Sweden and unemployment rate among males in the United States with a correlation coefficient (R) of 0.259 and weighted average of 5.0%, a difference of 13.4%.
Male Unemployment Correlation Summary
| Measurement | Immigrants from Cuba | Immigrants from Sweden |
| Minimum | 0.90% | 2.1% |
| Maximum | 9.5% | 34.6% |
| Range | 8.6% | 32.5% |
| Mean | 4.3% | 7.8% |
| Median | 4.2% | 5.3% |
| Interquartile 25% (IQ1) | 3.1% | 4.4% |
| Interquartile 75% (IQ3) | 5.4% | 6.9% |
| Interquartile Range (IQR) | 2.3% | 2.5% |
| Standard Deviation (Sample) | 1.6% | 7.4% |
| Standard Deviation (Population) | 1.6% | 7.3% |
Similar Demographics by Male Unemployment
Demographics Similar to Immigrants from Cuba by Male Unemployment
In terms of male unemployment, the demographic groups most similar to Immigrants from Cuba are Norwegian (4.4%, a difference of 0.24%), Immigrants from Venezuela (4.4%, a difference of 0.58%), Immigrants from India (4.4%, a difference of 1.1%), Danish (4.5%, a difference of 1.6%), and Venezuelan (4.5%, a difference of 2.1%).
| Demographics | Rating | Rank | Male Unemployment |
| Immigrants | India | 100.0 /100 | #1 | Exceptional 4.4% |
| Immigrants | Cuba | 100.0 /100 | #2 | Exceptional 4.4% |
| Norwegians | 100.0 /100 | #3 | Exceptional 4.4% |
| Immigrants | Venezuela | 100.0 /100 | #4 | Exceptional 4.4% |
| Danes | 100.0 /100 | #5 | Exceptional 4.5% |
| Venezuelans | 100.0 /100 | #6 | Exceptional 4.5% |
| Czechs | 100.0 /100 | #7 | Exceptional 4.5% |
| Luxembourgers | 100.0 /100 | #8 | Exceptional 4.5% |
| Thais | 100.0 /100 | #9 | Exceptional 4.6% |
| Cubans | 100.0 /100 | #10 | Exceptional 4.6% |
| Swedes | 100.0 /100 | #11 | Exceptional 4.6% |
| Immigrants | Bolivia | 100.0 /100 | #12 | Exceptional 4.7% |
| Bolivians | 100.0 /100 | #13 | Exceptional 4.7% |
| Germans | 100.0 /100 | #14 | Exceptional 4.7% |
| Scandinavians | 100.0 /100 | #15 | Exceptional 4.7% |
Demographics Similar to Immigrants from Sweden by Male Unemployment
In terms of male unemployment, the demographic groups most similar to Immigrants from Sweden are Australian (5.0%, a difference of 0.030%), Immigrants from Canada (5.0%, a difference of 0.040%), White/Caucasian (5.0%, a difference of 0.050%), Finnish (5.0%, a difference of 0.060%), and New Zealander (5.0%, a difference of 0.070%).
| Demographics | Rating | Rank | Male Unemployment |
| Basques | 97.9 /100 | #62 | Exceptional 5.0% |
| Eastern Europeans | 97.9 /100 | #63 | Exceptional 5.0% |
| Celtics | 97.8 /100 | #64 | Exceptional 5.0% |
| Icelanders | 97.6 /100 | #65 | Exceptional 5.0% |
| Finns | 97.5 /100 | #66 | Exceptional 5.0% |
| Immigrants | Canada | 97.5 /100 | #67 | Exceptional 5.0% |
| Australians | 97.4 /100 | #68 | Exceptional 5.0% |
| Immigrants | Sweden | 97.4 /100 | #69 | Exceptional 5.0% |
| Whites/Caucasians | 97.3 /100 | #70 | Exceptional 5.0% |
| New Zealanders | 97.3 /100 | #71 | Exceptional 5.0% |
| Immigrants | South Africa | 97.1 /100 | #72 | Exceptional 5.0% |
| Greeks | 97.0 /100 | #73 | Exceptional 5.0% |
| Immigrants | North America | 96.9 /100 | #74 | Exceptional 5.0% |
| Assyrians/Chaldeans/Syriacs | 96.9 /100 | #75 | Exceptional 5.0% |
| Immigrants | Sudan | 96.5 /100 | #76 | Exceptional 5.0% |