Immigrants from Cuba vs Israeli Male Unemployment
COMPARE
Immigrants from Cuba
Israeli
Male Unemployment
Male Unemployment Comparison
Immigrants from Cuba
Israelis
4.4%
MALE UNEMPLOYMENT
100.0/ 100
METRIC RATING
2nd/ 347
METRIC RANK
5.5%
MALE UNEMPLOYMENT
7.4/ 100
METRIC RATING
211th/ 347
METRIC RANK
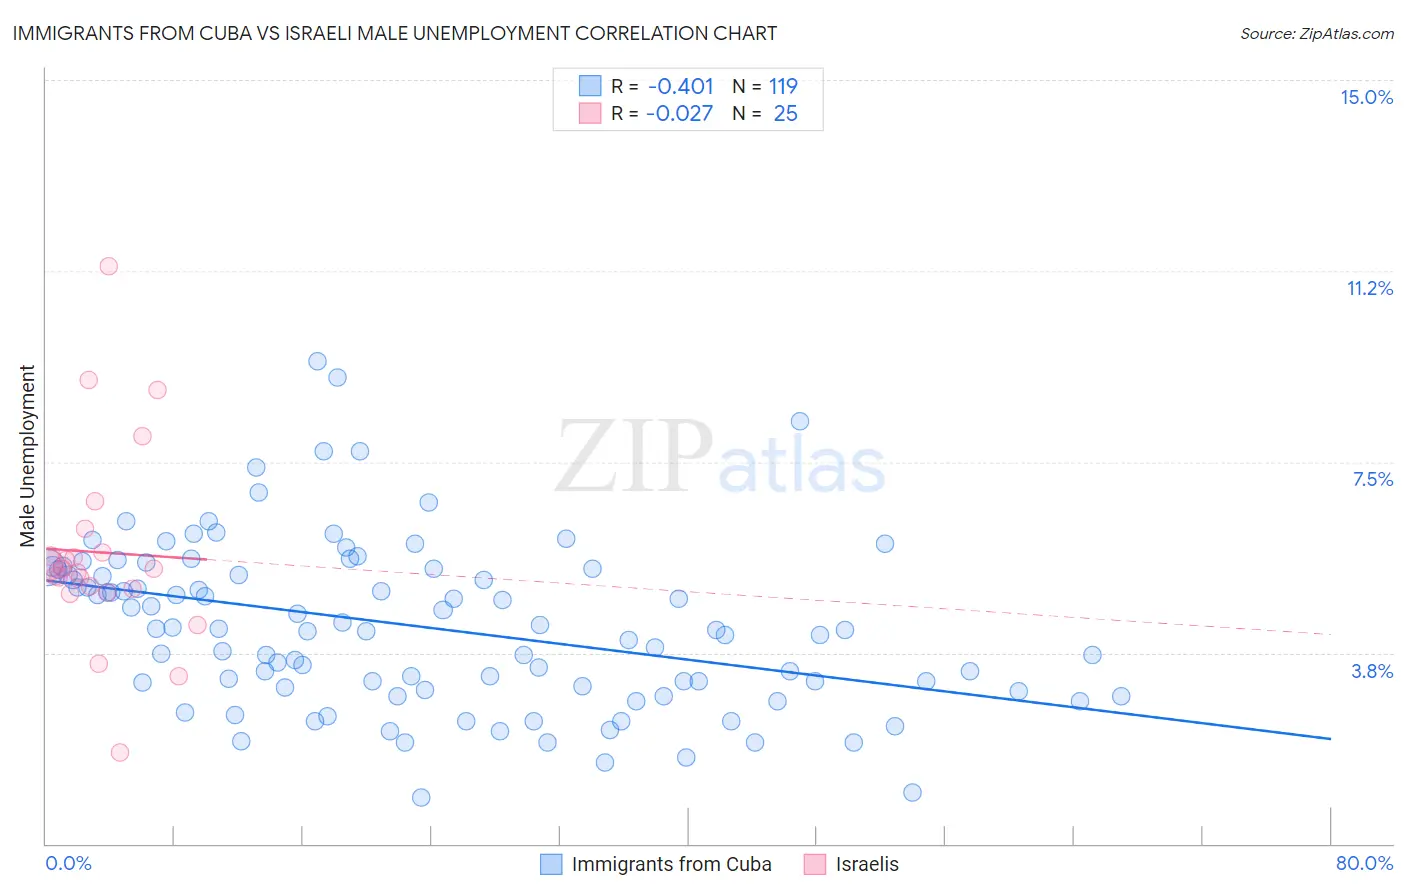
Immigrants from Cuba vs Israeli Male Unemployment Correlation Chart
The statistical analysis conducted on geographies consisting of 325,045,859 people shows a moderate negative correlation between the proportion of Immigrants from Cuba and unemployment rate among males in the United States with a correlation coefficient (R) of -0.401 and weighted average of 4.4%. Similarly, the statistical analysis conducted on geographies consisting of 210,829,050 people shows no correlation between the proportion of Israelis and unemployment rate among males in the United States with a correlation coefficient (R) of -0.027 and weighted average of 5.5%, a difference of 24.1%.
Male Unemployment Correlation Summary
| Measurement | Immigrants from Cuba | Israeli |
| Minimum | 0.90% | 1.8% |
| Maximum | 9.5% | 11.3% |
| Range | 8.6% | 9.5% |
| Mean | 4.3% | 5.7% |
| Median | 4.2% | 5.4% |
| Interquartile 25% (IQ1) | 3.1% | 5.0% |
| Interquartile 75% (IQ3) | 5.4% | 6.0% |
| Interquartile Range (IQR) | 2.3% | 0.98% |
| Standard Deviation (Sample) | 1.6% | 1.9% |
| Standard Deviation (Population) | 1.6% | 1.9% |
Similar Demographics by Male Unemployment
Demographics Similar to Immigrants from Cuba by Male Unemployment
In terms of male unemployment, the demographic groups most similar to Immigrants from Cuba are Norwegian (4.4%, a difference of 0.24%), Immigrants from Venezuela (4.4%, a difference of 0.58%), Immigrants from India (4.4%, a difference of 1.1%), Danish (4.5%, a difference of 1.6%), and Venezuelan (4.5%, a difference of 2.1%).
| Demographics | Rating | Rank | Male Unemployment |
| Immigrants | India | 100.0 /100 | #1 | Exceptional 4.4% |
| Immigrants | Cuba | 100.0 /100 | #2 | Exceptional 4.4% |
| Norwegians | 100.0 /100 | #3 | Exceptional 4.4% |
| Immigrants | Venezuela | 100.0 /100 | #4 | Exceptional 4.4% |
| Danes | 100.0 /100 | #5 | Exceptional 4.5% |
| Venezuelans | 100.0 /100 | #6 | Exceptional 4.5% |
| Czechs | 100.0 /100 | #7 | Exceptional 4.5% |
| Luxembourgers | 100.0 /100 | #8 | Exceptional 4.5% |
| Thais | 100.0 /100 | #9 | Exceptional 4.6% |
| Cubans | 100.0 /100 | #10 | Exceptional 4.6% |
| Swedes | 100.0 /100 | #11 | Exceptional 4.6% |
| Immigrants | Bolivia | 100.0 /100 | #12 | Exceptional 4.7% |
| Bolivians | 100.0 /100 | #13 | Exceptional 4.7% |
| Germans | 100.0 /100 | #14 | Exceptional 4.7% |
| Scandinavians | 100.0 /100 | #15 | Exceptional 4.7% |
Demographics Similar to Israelis by Male Unemployment
In terms of male unemployment, the demographic groups most similar to Israelis are South American Indian (5.5%, a difference of 0.040%), Hmong (5.5%, a difference of 0.090%), Immigrants from Middle Africa (5.5%, a difference of 0.17%), Immigrants from Lebanon (5.5%, a difference of 0.22%), and Ugandan (5.5%, a difference of 0.25%).
| Demographics | Rating | Rank | Male Unemployment |
| Guamanians/Chamorros | 12.3 /100 | #204 | Poor 5.4% |
| Immigrants | Costa Rica | 11.4 /100 | #205 | Poor 5.5% |
| Immigrants | Ukraine | 9.9 /100 | #206 | Tragic 5.5% |
| Immigrants | Syria | 9.3 /100 | #207 | Tragic 5.5% |
| Immigrants | Lebanon | 8.6 /100 | #208 | Tragic 5.5% |
| Immigrants | Middle Africa | 8.3 /100 | #209 | Tragic 5.5% |
| South American Indians | 7.6 /100 | #210 | Tragic 5.5% |
| Israelis | 7.4 /100 | #211 | Tragic 5.5% |
| Hmong | 7.0 /100 | #212 | Tragic 5.5% |
| Ugandans | 6.3 /100 | #213 | Tragic 5.5% |
| Puget Sound Salish | 5.6 /100 | #214 | Tragic 5.5% |
| Samoans | 4.9 /100 | #215 | Tragic 5.5% |
| Immigrants | Immigrants | 4.3 /100 | #216 | Tragic 5.5% |
| Delaware | 4.2 /100 | #217 | Tragic 5.5% |
| Immigrants | Albania | 3.6 /100 | #218 | Tragic 5.5% |