Immigrants from Cuba vs Japanese Unemployment
COMPARE
Immigrants from Cuba
Japanese
Unemployment
Unemployment Comparison
Immigrants from Cuba
Japanese
4.6%
UNEMPLOYMENT
100.0/ 100
METRIC RATING
14th/ 347
METRIC RANK
5.6%
UNEMPLOYMENT
0.8/ 100
METRIC RATING
250th/ 347
METRIC RANK
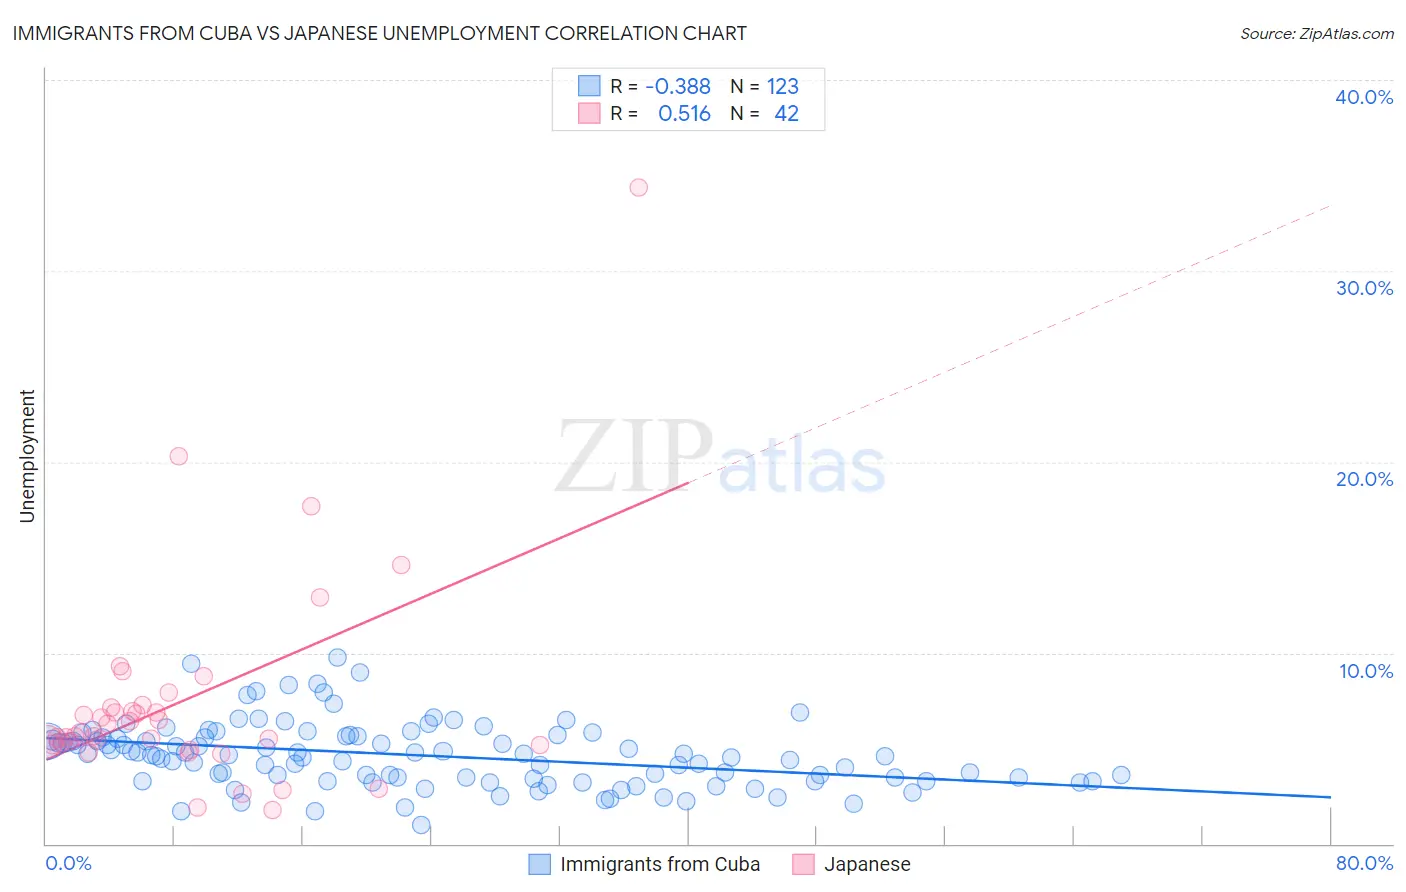
Immigrants from Cuba vs Japanese Unemployment Correlation Chart
The statistical analysis conducted on geographies consisting of 325,813,877 people shows a mild negative correlation between the proportion of Immigrants from Cuba and unemployment in the United States with a correlation coefficient (R) of -0.388 and weighted average of 4.6%. Similarly, the statistical analysis conducted on geographies consisting of 249,076,576 people shows a substantial positive correlation between the proportion of Japanese and unemployment in the United States with a correlation coefficient (R) of 0.516 and weighted average of 5.6%, a difference of 22.2%.
Unemployment Correlation Summary
| Measurement | Immigrants from Cuba | Japanese |
| Minimum | 1.0% | 1.8% |
| Maximum | 9.8% | 34.4% |
| Range | 8.8% | 32.6% |
| Mean | 4.6% | 7.4% |
| Median | 4.7% | 5.8% |
| Interquartile 25% (IQ1) | 3.4% | 5.2% |
| Interquartile 75% (IQ3) | 5.6% | 7.1% |
| Interquartile Range (IQR) | 2.2% | 1.9% |
| Standard Deviation (Sample) | 1.7% | 5.6% |
| Standard Deviation (Population) | 1.7% | 5.6% |
Similar Demographics by Unemployment
Demographics Similar to Immigrants from Cuba by Unemployment
In terms of unemployment, the demographic groups most similar to Immigrants from Cuba are Belgian (4.6%, a difference of 0.24%), Pennsylvania German (4.6%, a difference of 0.40%), European (4.6%, a difference of 0.48%), English (4.6%, a difference of 0.50%), and Chinese (4.7%, a difference of 0.62%).
| Demographics | Rating | Rank | Unemployment |
| Immigrants | India | 100.0 /100 | #7 | Exceptional 4.5% |
| Swiss | 100.0 /100 | #8 | Exceptional 4.5% |
| Scandinavians | 100.0 /100 | #9 | Exceptional 4.5% |
| Dutch | 100.0 /100 | #10 | Exceptional 4.6% |
| English | 100.0 /100 | #11 | Exceptional 4.6% |
| Pennsylvania Germans | 100.0 /100 | #12 | Exceptional 4.6% |
| Belgians | 100.0 /100 | #13 | Exceptional 4.6% |
| Immigrants | Cuba | 100.0 /100 | #14 | Exceptional 4.6% |
| Europeans | 99.9 /100 | #15 | Exceptional 4.6% |
| Chinese | 99.9 /100 | #16 | Exceptional 4.7% |
| Slovenes | 99.9 /100 | #17 | Exceptional 4.7% |
| Immigrants | Venezuela | 99.9 /100 | #18 | Exceptional 4.7% |
| Scottish | 99.9 /100 | #19 | Exceptional 4.7% |
| Carpatho Rusyns | 99.9 /100 | #20 | Exceptional 4.7% |
| Welsh | 99.9 /100 | #21 | Exceptional 4.7% |
Demographics Similar to Japanese by Unemployment
In terms of unemployment, the demographic groups most similar to Japanese are Cajun (5.6%, a difference of 0.010%), Liberian (5.6%, a difference of 0.27%), Immigrants from Cameroon (5.6%, a difference of 0.40%), Kiowa (5.7%, a difference of 0.47%), and Bermudan (5.6%, a difference of 0.55%).
| Demographics | Rating | Rank | Unemployment |
| Marshallese | 1.3 /100 | #243 | Tragic 5.6% |
| Dutch West Indians | 1.2 /100 | #244 | Tragic 5.6% |
| French American Indians | 1.2 /100 | #245 | Tragic 5.6% |
| Bermudans | 1.1 /100 | #246 | Tragic 5.6% |
| Immigrants | Cameroon | 1.0 /100 | #247 | Tragic 5.6% |
| Liberians | 0.9 /100 | #248 | Tragic 5.6% |
| Cajuns | 0.8 /100 | #249 | Tragic 5.6% |
| Japanese | 0.8 /100 | #250 | Tragic 5.6% |
| Kiowa | 0.6 /100 | #251 | Tragic 5.7% |
| Hondurans | 0.3 /100 | #252 | Tragic 5.7% |
| Central Americans | 0.3 /100 | #253 | Tragic 5.7% |
| Immigrants | Honduras | 0.3 /100 | #254 | Tragic 5.7% |
| Immigrants | Portugal | 0.2 /100 | #255 | Tragic 5.7% |
| Guatemalans | 0.2 /100 | #256 | Tragic 5.8% |
| Yaqui | 0.2 /100 | #257 | Tragic 5.8% |