Immigrants from Central America vs German Russian Unemployment
COMPARE
Immigrants from Central America
German Russian
Unemployment
Unemployment Comparison
Immigrants from Central America
German Russians
6.0%
UNEMPLOYMENT
0.0/ 100
METRIC RATING
276th/ 347
METRIC RANK
4.9%
UNEMPLOYMENT
98.0/ 100
METRIC RATING
76th/ 347
METRIC RANK
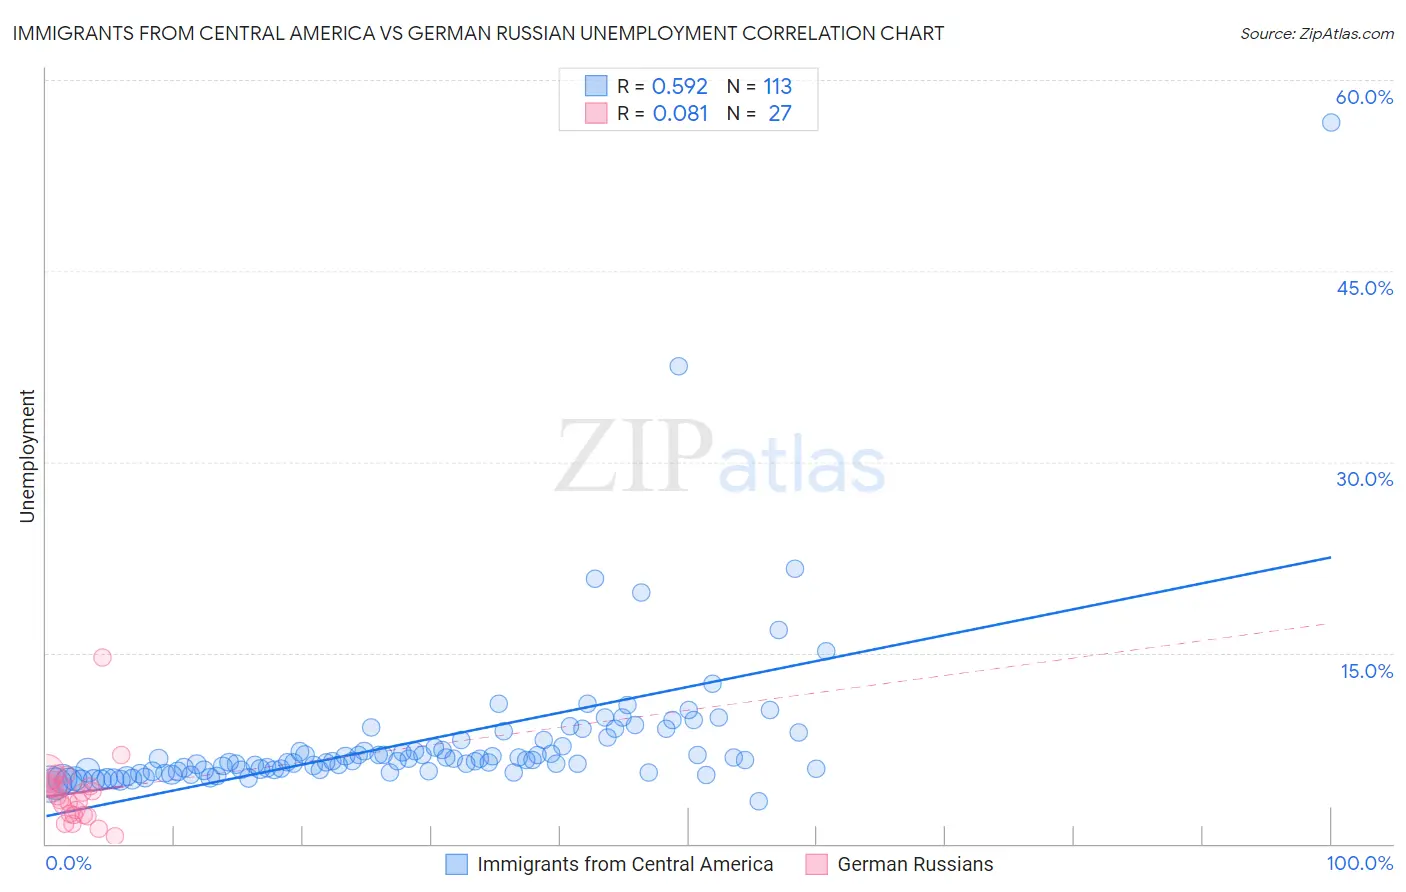
Immigrants from Central America vs German Russian Unemployment Correlation Chart
The statistical analysis conducted on geographies consisting of 534,368,587 people shows a substantial positive correlation between the proportion of Immigrants from Central America and unemployment in the United States with a correlation coefficient (R) of 0.592 and weighted average of 6.0%. Similarly, the statistical analysis conducted on geographies consisting of 96,379,174 people shows a slight positive correlation between the proportion of German Russians and unemployment in the United States with a correlation coefficient (R) of 0.081 and weighted average of 4.9%, a difference of 20.5%.
Unemployment Correlation Summary
| Measurement | Immigrants from Central America | German Russian |
| Minimum | 3.3% | 0.60% |
| Maximum | 56.6% | 14.6% |
| Range | 53.3% | 14.0% |
| Mean | 8.1% | 4.0% |
| Median | 6.5% | 3.8% |
| Interquartile 25% (IQ1) | 5.7% | 2.3% |
| Interquartile 75% (IQ3) | 8.1% | 4.7% |
| Interquartile Range (IQR) | 2.4% | 2.4% |
| Standard Deviation (Sample) | 6.2% | 2.6% |
| Standard Deviation (Population) | 6.2% | 2.6% |
Similar Demographics by Unemployment
Demographics Similar to Immigrants from Central America by Unemployment
In terms of unemployment, the demographic groups most similar to Immigrants from Central America are Immigrants from Latin America (5.9%, a difference of 0.28%), Armenian (6.0%, a difference of 0.35%), Bahamian (5.9%, a difference of 0.49%), Ghanaian (6.0%, a difference of 0.64%), and Immigrants from Fiji (5.9%, a difference of 0.78%).
| Demographics | Rating | Rank | Unemployment |
| Immigrants | El Salvador | 0.1 /100 | #269 | Tragic 5.8% |
| Blackfeet | 0.1 /100 | #270 | Tragic 5.8% |
| Mexicans | 0.1 /100 | #271 | Tragic 5.9% |
| Hispanics or Latinos | 0.0 /100 | #272 | Tragic 5.9% |
| Immigrants | Fiji | 0.0 /100 | #273 | Tragic 5.9% |
| Bahamians | 0.0 /100 | #274 | Tragic 5.9% |
| Immigrants | Latin America | 0.0 /100 | #275 | Tragic 5.9% |
| Immigrants | Central America | 0.0 /100 | #276 | Tragic 6.0% |
| Armenians | 0.0 /100 | #277 | Tragic 6.0% |
| Ghanaians | 0.0 /100 | #278 | Tragic 6.0% |
| Immigrants | Mexico | 0.0 /100 | #279 | Tragic 6.0% |
| Immigrants | Western Africa | 0.0 /100 | #280 | Tragic 6.0% |
| Africans | 0.0 /100 | #281 | Tragic 6.1% |
| Immigrants | Azores | 0.0 /100 | #282 | Tragic 6.1% |
| Immigrants | Ghana | 0.0 /100 | #283 | Tragic 6.1% |
Demographics Similar to German Russians by Unemployment
In terms of unemployment, the demographic groups most similar to German Russians are Turkish (4.9%, a difference of 0.030%), Cypriot (4.9%, a difference of 0.060%), Okinawan (4.9%, a difference of 0.10%), Immigrants from Northern Europe (4.9%, a difference of 0.16%), and Canadian (5.0%, a difference of 0.22%).
| Demographics | Rating | Rank | Unemployment |
| Immigrants | North America | 98.5 /100 | #69 | Exceptional 4.9% |
| Serbians | 98.4 /100 | #70 | Exceptional 4.9% |
| Immigrants | Japan | 98.3 /100 | #71 | Exceptional 4.9% |
| Burmese | 98.3 /100 | #72 | Exceptional 4.9% |
| Paraguayans | 98.3 /100 | #73 | Exceptional 4.9% |
| Immigrants | Northern Europe | 98.2 /100 | #74 | Exceptional 4.9% |
| Turks | 98.0 /100 | #75 | Exceptional 4.9% |
| German Russians | 98.0 /100 | #76 | Exceptional 4.9% |
| Cypriots | 97.9 /100 | #77 | Exceptional 4.9% |
| Okinawans | 97.9 /100 | #78 | Exceptional 4.9% |
| Canadians | 97.7 /100 | #79 | Exceptional 5.0% |
| Immigrants | Sweden | 97.6 /100 | #80 | Exceptional 5.0% |
| Basques | 97.6 /100 | #81 | Exceptional 5.0% |
| Fijians | 97.6 /100 | #82 | Exceptional 5.0% |
| Hmong | 97.6 /100 | #83 | Exceptional 5.0% |