Immigrants from Central America vs Cajun Unemployment
COMPARE
Immigrants from Central America
Cajun
Unemployment
Unemployment Comparison
Immigrants from Central America
Cajuns
6.0%
UNEMPLOYMENT
0.0/ 100
METRIC RATING
276th/ 347
METRIC RANK
5.6%
UNEMPLOYMENT
0.8/ 100
METRIC RATING
249th/ 347
METRIC RANK
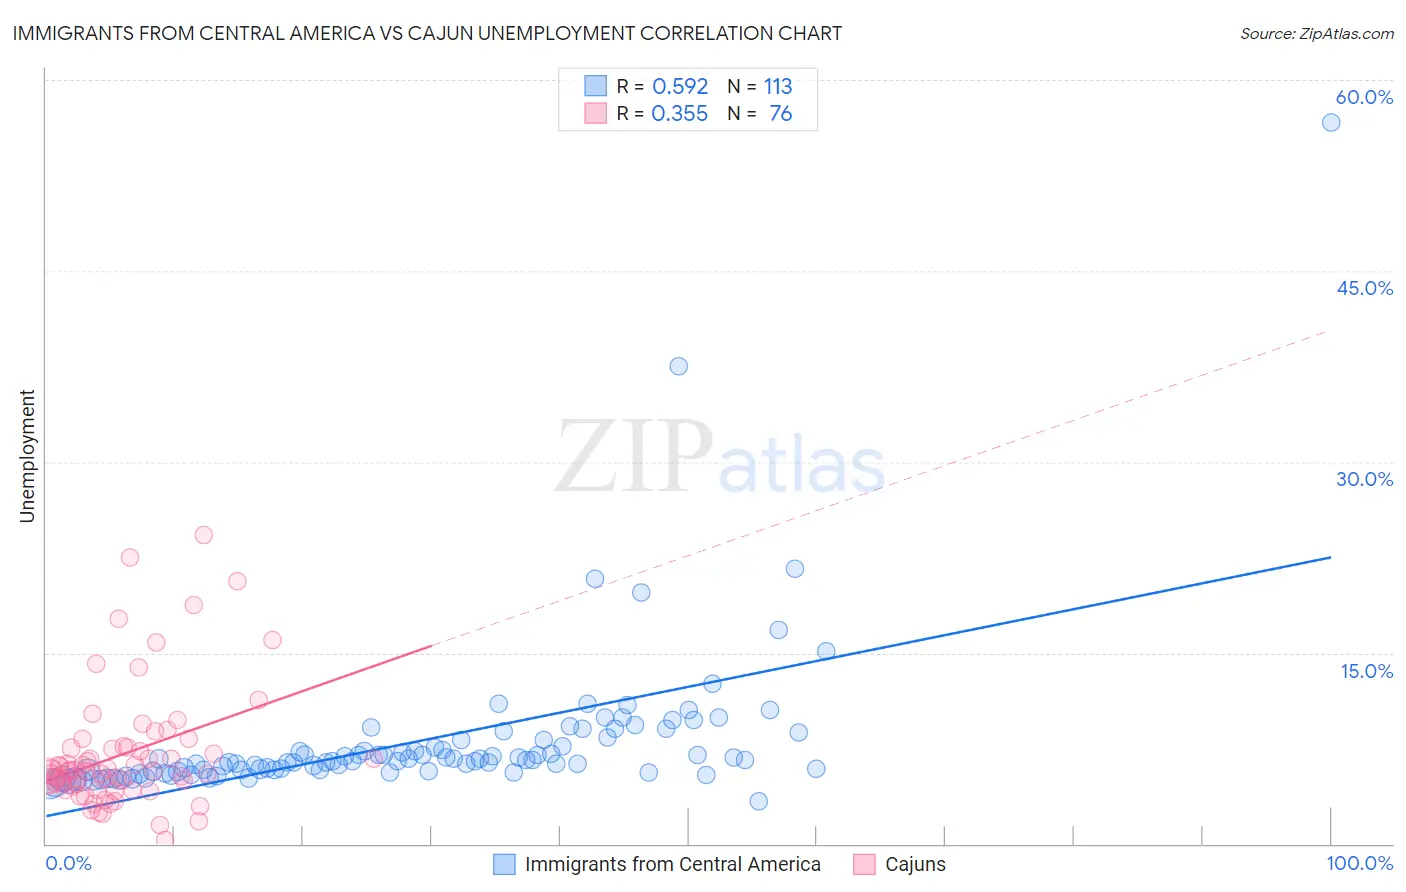
Immigrants from Central America vs Cajun Unemployment Correlation Chart
The statistical analysis conducted on geographies consisting of 534,368,587 people shows a substantial positive correlation between the proportion of Immigrants from Central America and unemployment in the United States with a correlation coefficient (R) of 0.592 and weighted average of 6.0%. Similarly, the statistical analysis conducted on geographies consisting of 149,579,258 people shows a mild positive correlation between the proportion of Cajuns and unemployment in the United States with a correlation coefficient (R) of 0.355 and weighted average of 5.6%, a difference of 5.4%.
Unemployment Correlation Summary
| Measurement | Immigrants from Central America | Cajun |
| Minimum | 3.3% | 0.30% |
| Maximum | 56.6% | 24.3% |
| Range | 53.3% | 24.0% |
| Mean | 8.1% | 7.0% |
| Median | 6.5% | 5.7% |
| Interquartile 25% (IQ1) | 5.7% | 4.6% |
| Interquartile 75% (IQ3) | 8.1% | 7.5% |
| Interquartile Range (IQR) | 2.4% | 2.9% |
| Standard Deviation (Sample) | 6.2% | 4.7% |
| Standard Deviation (Population) | 6.2% | 4.7% |
Similar Demographics by Unemployment
Demographics Similar to Immigrants from Central America by Unemployment
In terms of unemployment, the demographic groups most similar to Immigrants from Central America are Immigrants from Latin America (5.9%, a difference of 0.28%), Armenian (6.0%, a difference of 0.35%), Bahamian (5.9%, a difference of 0.49%), Ghanaian (6.0%, a difference of 0.64%), and Immigrants from Fiji (5.9%, a difference of 0.78%).
| Demographics | Rating | Rank | Unemployment |
| Immigrants | El Salvador | 0.1 /100 | #269 | Tragic 5.8% |
| Blackfeet | 0.1 /100 | #270 | Tragic 5.8% |
| Mexicans | 0.1 /100 | #271 | Tragic 5.9% |
| Hispanics or Latinos | 0.0 /100 | #272 | Tragic 5.9% |
| Immigrants | Fiji | 0.0 /100 | #273 | Tragic 5.9% |
| Bahamians | 0.0 /100 | #274 | Tragic 5.9% |
| Immigrants | Latin America | 0.0 /100 | #275 | Tragic 5.9% |
| Immigrants | Central America | 0.0 /100 | #276 | Tragic 6.0% |
| Armenians | 0.0 /100 | #277 | Tragic 6.0% |
| Ghanaians | 0.0 /100 | #278 | Tragic 6.0% |
| Immigrants | Mexico | 0.0 /100 | #279 | Tragic 6.0% |
| Immigrants | Western Africa | 0.0 /100 | #280 | Tragic 6.0% |
| Africans | 0.0 /100 | #281 | Tragic 6.1% |
| Immigrants | Azores | 0.0 /100 | #282 | Tragic 6.1% |
| Immigrants | Ghana | 0.0 /100 | #283 | Tragic 6.1% |
Demographics Similar to Cajuns by Unemployment
In terms of unemployment, the demographic groups most similar to Cajuns are Japanese (5.6%, a difference of 0.010%), Liberian (5.6%, a difference of 0.26%), Immigrants from Cameroon (5.6%, a difference of 0.39%), Kiowa (5.7%, a difference of 0.48%), and Bermudan (5.6%, a difference of 0.54%).
| Demographics | Rating | Rank | Unemployment |
| Spanish Americans | 2.0 /100 | #242 | Tragic 5.6% |
| Marshallese | 1.3 /100 | #243 | Tragic 5.6% |
| Dutch West Indians | 1.2 /100 | #244 | Tragic 5.6% |
| French American Indians | 1.2 /100 | #245 | Tragic 5.6% |
| Bermudans | 1.1 /100 | #246 | Tragic 5.6% |
| Immigrants | Cameroon | 1.0 /100 | #247 | Tragic 5.6% |
| Liberians | 0.9 /100 | #248 | Tragic 5.6% |
| Cajuns | 0.8 /100 | #249 | Tragic 5.6% |
| Japanese | 0.8 /100 | #250 | Tragic 5.6% |
| Kiowa | 0.6 /100 | #251 | Tragic 5.7% |
| Hondurans | 0.3 /100 | #252 | Tragic 5.7% |
| Central Americans | 0.3 /100 | #253 | Tragic 5.7% |
| Immigrants | Honduras | 0.3 /100 | #254 | Tragic 5.7% |
| Immigrants | Portugal | 0.2 /100 | #255 | Tragic 5.7% |
| Guatemalans | 0.2 /100 | #256 | Tragic 5.8% |