Immigrants from Central America vs Immigrants from Iraq Unemployment
COMPARE
Immigrants from Central America
Immigrants from Iraq
Unemployment
Unemployment Comparison
Immigrants from Central America
Immigrants from Iraq
6.0%
UNEMPLOYMENT
0.0/ 100
METRIC RATING
276th/ 347
METRIC RANK
5.4%
UNEMPLOYMENT
18.6/ 100
METRIC RATING
210th/ 347
METRIC RANK
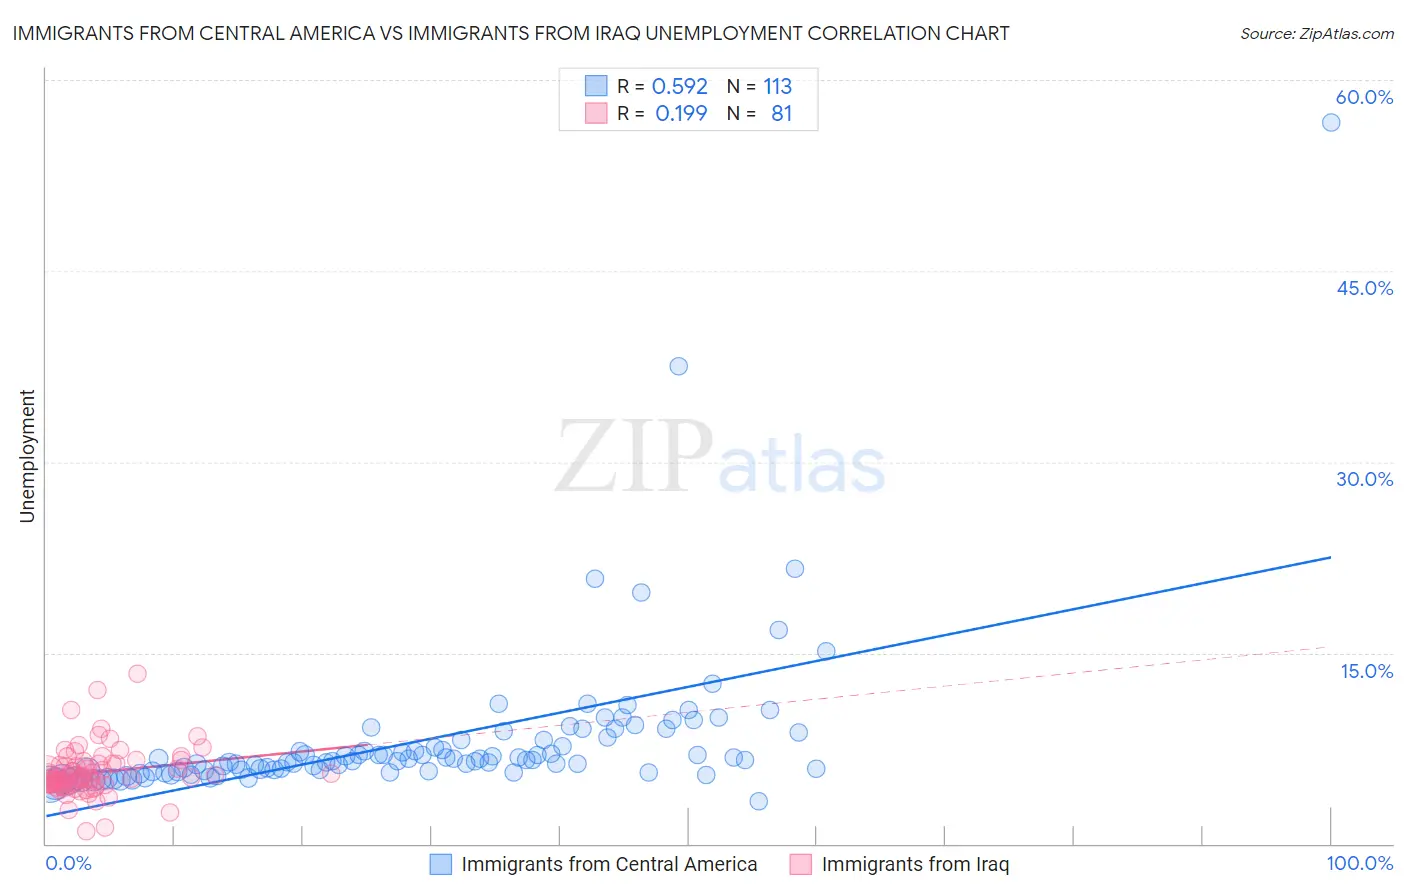
Immigrants from Central America vs Immigrants from Iraq Unemployment Correlation Chart
The statistical analysis conducted on geographies consisting of 534,368,587 people shows a substantial positive correlation between the proportion of Immigrants from Central America and unemployment in the United States with a correlation coefficient (R) of 0.592 and weighted average of 6.0%. Similarly, the statistical analysis conducted on geographies consisting of 194,739,178 people shows a poor positive correlation between the proportion of Immigrants from Iraq and unemployment in the United States with a correlation coefficient (R) of 0.199 and weighted average of 5.4%, a difference of 10.7%.
Unemployment Correlation Summary
| Measurement | Immigrants from Central America | Immigrants from Iraq |
| Minimum | 3.3% | 1.0% |
| Maximum | 56.6% | 13.4% |
| Range | 53.3% | 12.4% |
| Mean | 8.1% | 5.6% |
| Median | 6.5% | 5.2% |
| Interquartile 25% (IQ1) | 5.7% | 4.6% |
| Interquartile 75% (IQ3) | 8.1% | 6.3% |
| Interquartile Range (IQR) | 2.4% | 1.6% |
| Standard Deviation (Sample) | 6.2% | 1.9% |
| Standard Deviation (Population) | 6.2% | 1.9% |
Similar Demographics by Unemployment
Demographics Similar to Immigrants from Central America by Unemployment
In terms of unemployment, the demographic groups most similar to Immigrants from Central America are Immigrants from Latin America (5.9%, a difference of 0.28%), Armenian (6.0%, a difference of 0.35%), Bahamian (5.9%, a difference of 0.49%), Ghanaian (6.0%, a difference of 0.64%), and Immigrants from Fiji (5.9%, a difference of 0.78%).
| Demographics | Rating | Rank | Unemployment |
| Immigrants | El Salvador | 0.1 /100 | #269 | Tragic 5.8% |
| Blackfeet | 0.1 /100 | #270 | Tragic 5.8% |
| Mexicans | 0.1 /100 | #271 | Tragic 5.9% |
| Hispanics or Latinos | 0.0 /100 | #272 | Tragic 5.9% |
| Immigrants | Fiji | 0.0 /100 | #273 | Tragic 5.9% |
| Bahamians | 0.0 /100 | #274 | Tragic 5.9% |
| Immigrants | Latin America | 0.0 /100 | #275 | Tragic 5.9% |
| Immigrants | Central America | 0.0 /100 | #276 | Tragic 6.0% |
| Armenians | 0.0 /100 | #277 | Tragic 6.0% |
| Ghanaians | 0.0 /100 | #278 | Tragic 6.0% |
| Immigrants | Mexico | 0.0 /100 | #279 | Tragic 6.0% |
| Immigrants | Western Africa | 0.0 /100 | #280 | Tragic 6.0% |
| Africans | 0.0 /100 | #281 | Tragic 6.1% |
| Immigrants | Azores | 0.0 /100 | #282 | Tragic 6.1% |
| Immigrants | Ghana | 0.0 /100 | #283 | Tragic 6.1% |
Demographics Similar to Immigrants from Iraq by Unemployment
In terms of unemployment, the demographic groups most similar to Immigrants from Iraq are Immigrants from Iran (5.4%, a difference of 0.020%), Portuguese (5.4%, a difference of 0.050%), Iraqi (5.4%, a difference of 0.050%), Ugandan (5.4%, a difference of 0.060%), and Creek (5.4%, a difference of 0.080%).
| Demographics | Rating | Rank | Unemployment |
| Immigrants | Micronesia | 25.2 /100 | #203 | Fair 5.3% |
| Immigrants | Ukraine | 24.9 /100 | #204 | Fair 5.3% |
| Native Hawaiians | 24.1 /100 | #205 | Fair 5.3% |
| Immigrants | Peru | 22.7 /100 | #206 | Fair 5.4% |
| Creek | 19.4 /100 | #207 | Poor 5.4% |
| Portuguese | 19.0 /100 | #208 | Poor 5.4% |
| Immigrants | Iran | 18.8 /100 | #209 | Poor 5.4% |
| Immigrants | Iraq | 18.6 /100 | #210 | Poor 5.4% |
| Iraqis | 18.1 /100 | #211 | Poor 5.4% |
| Ugandans | 18.0 /100 | #212 | Poor 5.4% |
| Immigrants | Middle Africa | 15.3 /100 | #213 | Poor 5.4% |
| Immigrants | Costa Rica | 15.2 /100 | #214 | Poor 5.4% |
| Delaware | 14.7 /100 | #215 | Poor 5.4% |
| Immigrants | South America | 13.5 /100 | #216 | Poor 5.4% |
| Immigrants | Albania | 13.5 /100 | #217 | Poor 5.4% |