Immigrants from Canada vs Moroccan Female Unemployment
COMPARE
Immigrants from Canada
Moroccan
Female Unemployment
Female Unemployment Comparison
Immigrants from Canada
Moroccans
4.9%
FEMALE UNEMPLOYMENT
98.6/ 100
METRIC RATING
61st/ 347
METRIC RANK
5.5%
FEMALE UNEMPLOYMENT
3.4/ 100
METRIC RATING
233rd/ 347
METRIC RANK
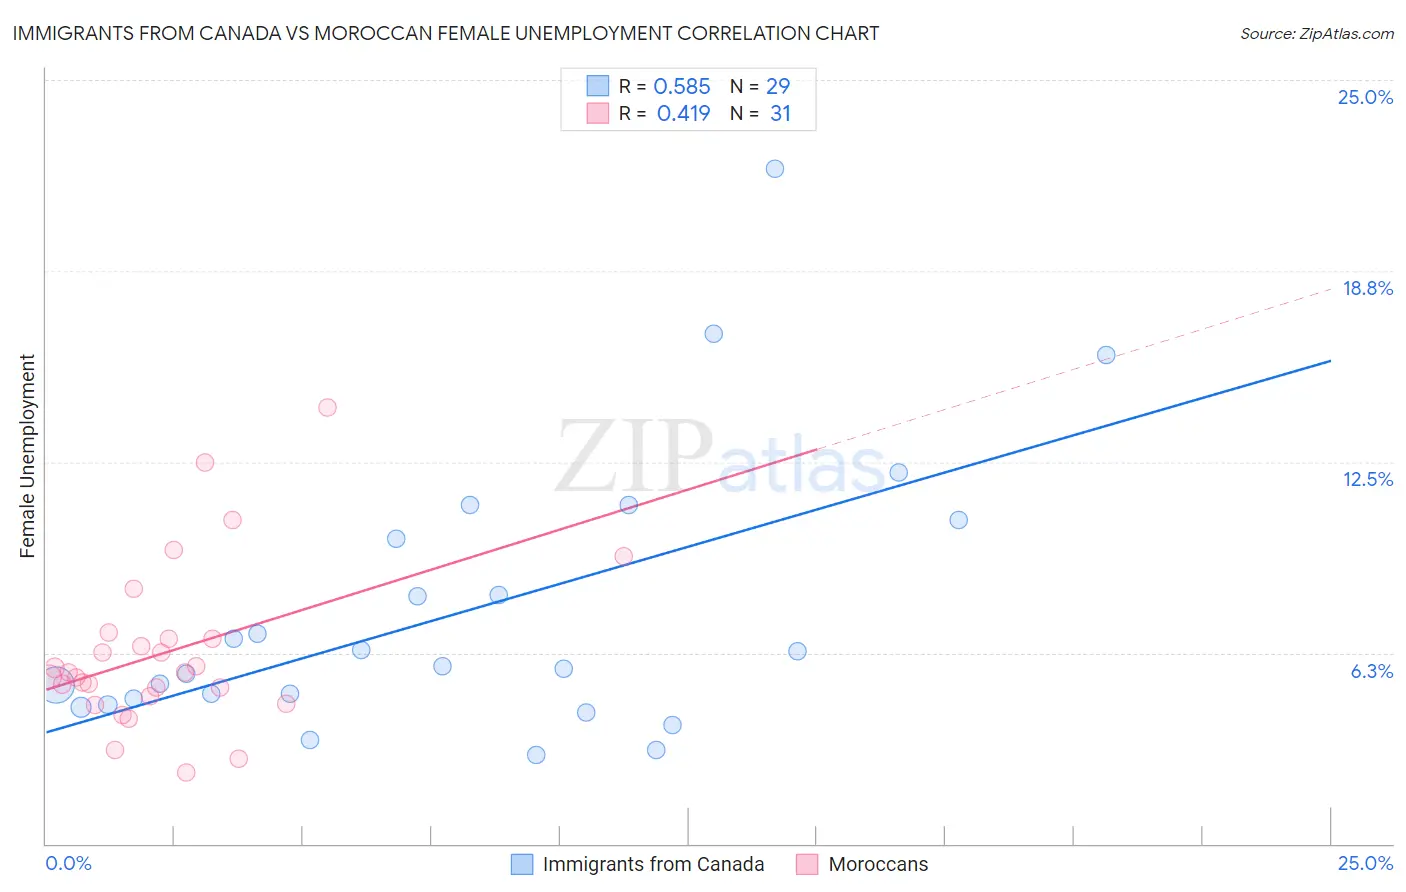
Immigrants from Canada vs Moroccan Female Unemployment Correlation Chart
The statistical analysis conducted on geographies consisting of 455,102,288 people shows a substantial positive correlation between the proportion of Immigrants from Canada and unemploymnet rate among females in the United States with a correlation coefficient (R) of 0.585 and weighted average of 4.9%. Similarly, the statistical analysis conducted on geographies consisting of 201,565,511 people shows a moderate positive correlation between the proportion of Moroccans and unemploymnet rate among females in the United States with a correlation coefficient (R) of 0.419 and weighted average of 5.5%, a difference of 12.2%.
Female Unemployment Correlation Summary
| Measurement | Immigrants from Canada | Moroccan |
| Minimum | 2.9% | 2.3% |
| Maximum | 22.1% | 14.3% |
| Range | 19.2% | 11.9% |
| Mean | 7.6% | 6.3% |
| Median | 5.8% | 5.6% |
| Interquartile 25% (IQ1) | 4.6% | 4.8% |
| Interquartile 75% (IQ3) | 10.3% | 6.7% |
| Interquartile Range (IQR) | 5.7% | 1.9% |
| Standard Deviation (Sample) | 4.5% | 2.7% |
| Standard Deviation (Population) | 4.5% | 2.6% |
Similar Demographics by Female Unemployment
Demographics Similar to Immigrants from Canada by Female Unemployment
In terms of female unemployment, the demographic groups most similar to Immigrants from Canada are Immigrants from Nepal (4.9%, a difference of 0.0%), Immigrants from Scotland (4.9%, a difference of 0.010%), Bhutanese (4.9%, a difference of 0.090%), Immigrants from Belgium (4.9%, a difference of 0.12%), and Celtic (4.9%, a difference of 0.12%).
| Demographics | Rating | Rank | Female Unemployment |
| Immigrants | Zimbabwe | 99.0 /100 | #54 | Exceptional 4.9% |
| Immigrants | Moldova | 99.0 /100 | #55 | Exceptional 4.9% |
| Serbians | 99.0 /100 | #56 | Exceptional 4.9% |
| Icelanders | 98.8 /100 | #57 | Exceptional 4.9% |
| Immigrants | Lithuania | 98.8 /100 | #58 | Exceptional 4.9% |
| Bhutanese | 98.7 /100 | #59 | Exceptional 4.9% |
| Immigrants | Scotland | 98.6 /100 | #60 | Exceptional 4.9% |
| Immigrants | Canada | 98.6 /100 | #61 | Exceptional 4.9% |
| Immigrants | Nepal | 98.6 /100 | #62 | Exceptional 4.9% |
| Immigrants | Belgium | 98.5 /100 | #63 | Exceptional 4.9% |
| Celtics | 98.5 /100 | #64 | Exceptional 4.9% |
| Immigrants | North America | 98.3 /100 | #65 | Exceptional 4.9% |
| Hungarians | 98.3 /100 | #66 | Exceptional 4.9% |
| Cubans | 98.3 /100 | #67 | Exceptional 4.9% |
| Tlingit-Haida | 98.3 /100 | #68 | Exceptional 4.9% |
Demographics Similar to Moroccans by Female Unemployment
In terms of female unemployment, the demographic groups most similar to Moroccans are Immigrants from Lebanon (5.5%, a difference of 0.020%), Immigrants from Iran (5.5%, a difference of 0.030%), Immigrants from Cambodia (5.5%, a difference of 0.060%), Immigrants from Panama (5.5%, a difference of 0.080%), and Sierra Leonean (5.5%, a difference of 0.10%).
| Demographics | Rating | Rank | Female Unemployment |
| Immigrants | Peru | 5.9 /100 | #226 | Tragic 5.5% |
| Immigrants | Philippines | 5.3 /100 | #227 | Tragic 5.5% |
| Israelis | 4.8 /100 | #228 | Tragic 5.5% |
| Panamanians | 4.7 /100 | #229 | Tragic 5.5% |
| Immigrants | Uruguay | 4.7 /100 | #230 | Tragic 5.5% |
| Immigrants | Iraq | 3.9 /100 | #231 | Tragic 5.5% |
| Liberians | 3.9 /100 | #232 | Tragic 5.5% |
| Moroccans | 3.4 /100 | #233 | Tragic 5.5% |
| Immigrants | Lebanon | 3.3 /100 | #234 | Tragic 5.5% |
| Immigrants | Iran | 3.3 /100 | #235 | Tragic 5.5% |
| Immigrants | Cambodia | 3.3 /100 | #236 | Tragic 5.5% |
| Immigrants | Panama | 3.2 /100 | #237 | Tragic 5.5% |
| Sierra Leoneans | 3.2 /100 | #238 | Tragic 5.5% |
| Aleuts | 3.0 /100 | #239 | Tragic 5.5% |
| Immigrants | South America | 2.9 /100 | #240 | Tragic 5.5% |