Italian vs Moroccan Female Unemployment
COMPARE
Italian
Moroccan
Female Unemployment
Female Unemployment Comparison
Italians
Moroccans
4.8%
FEMALE UNEMPLOYMENT
99.5/ 100
METRIC RATING
42nd/ 347
METRIC RANK
5.5%
FEMALE UNEMPLOYMENT
3.4/ 100
METRIC RATING
233rd/ 347
METRIC RANK
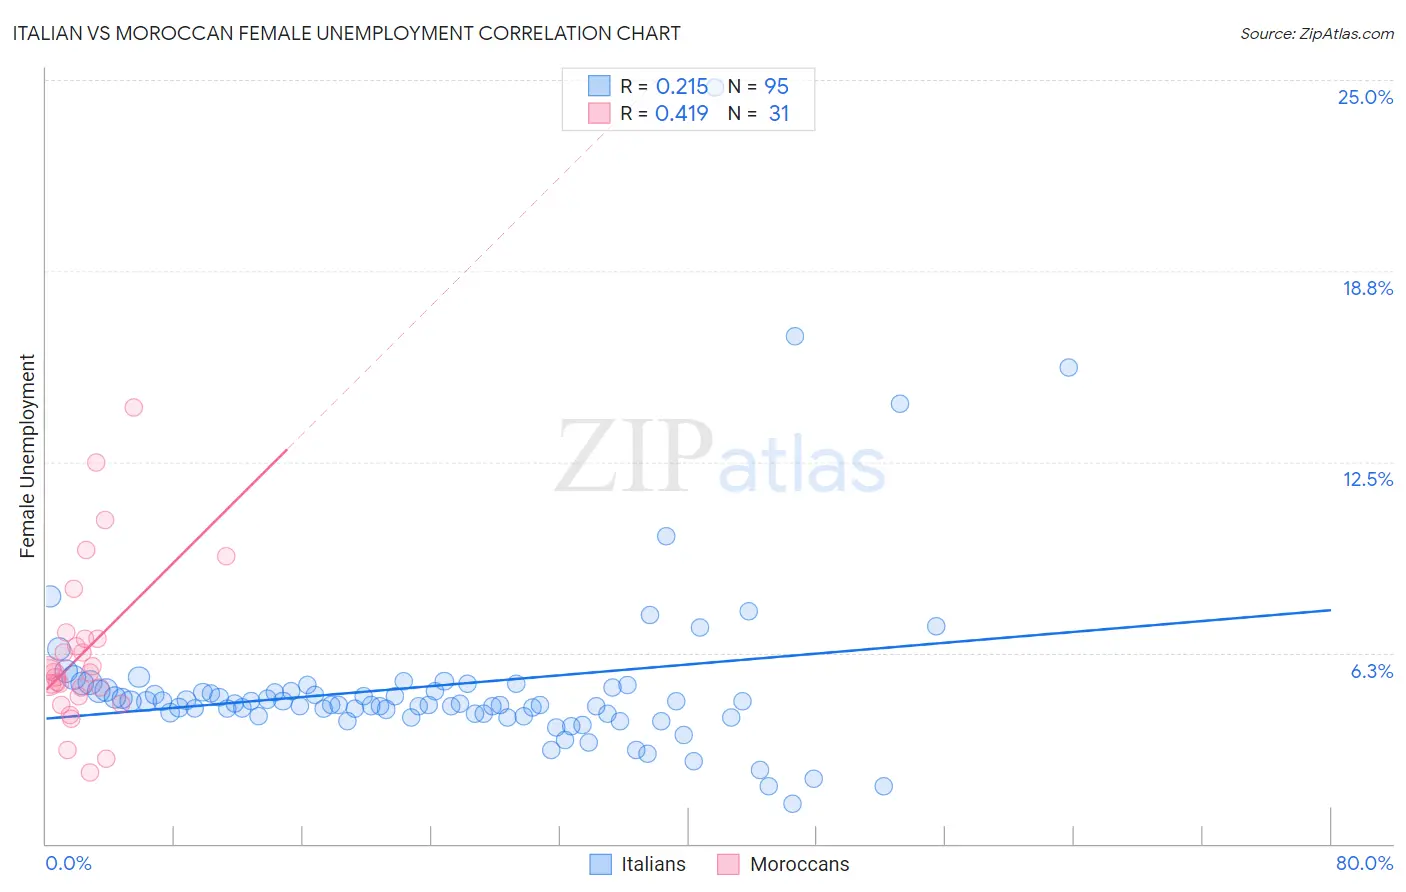
Italian vs Moroccan Female Unemployment Correlation Chart
The statistical analysis conducted on geographies consisting of 560,779,263 people shows a weak positive correlation between the proportion of Italians and unemploymnet rate among females in the United States with a correlation coefficient (R) of 0.215 and weighted average of 4.8%. Similarly, the statistical analysis conducted on geographies consisting of 201,565,511 people shows a moderate positive correlation between the proportion of Moroccans and unemploymnet rate among females in the United States with a correlation coefficient (R) of 0.419 and weighted average of 5.5%, a difference of 14.0%.
Female Unemployment Correlation Summary
| Measurement | Italian | Moroccan |
| Minimum | 1.3% | 2.3% |
| Maximum | 24.8% | 14.3% |
| Range | 23.5% | 11.9% |
| Mean | 5.2% | 6.3% |
| Median | 4.6% | 5.6% |
| Interquartile 25% (IQ1) | 4.2% | 4.8% |
| Interquartile 75% (IQ3) | 5.0% | 6.7% |
| Interquartile Range (IQR) | 0.79% | 1.9% |
| Standard Deviation (Sample) | 3.1% | 2.7% |
| Standard Deviation (Population) | 3.0% | 2.6% |
Similar Demographics by Female Unemployment
Demographics Similar to Italians by Female Unemployment
In terms of female unemployment, the demographic groups most similar to Italians are Tongan (4.8%, a difference of 0.13%), Eastern European (4.9%, a difference of 0.17%), Greek (4.9%, a difference of 0.28%), Austrian (4.9%, a difference of 0.36%), and Immigrants from Bulgaria (4.9%, a difference of 0.38%).
| Demographics | Rating | Rank | Female Unemployment |
| French Canadians | 99.7 /100 | #35 | Exceptional 4.8% |
| Yugoslavians | 99.7 /100 | #36 | Exceptional 4.8% |
| Pennsylvania Germans | 99.6 /100 | #37 | Exceptional 4.8% |
| Northern Europeans | 99.6 /100 | #38 | Exceptional 4.8% |
| Scotch-Irish | 99.6 /100 | #39 | Exceptional 4.8% |
| French | 99.6 /100 | #40 | Exceptional 4.8% |
| Tongans | 99.5 /100 | #41 | Exceptional 4.8% |
| Italians | 99.5 /100 | #42 | Exceptional 4.8% |
| Eastern Europeans | 99.4 /100 | #43 | Exceptional 4.9% |
| Greeks | 99.4 /100 | #44 | Exceptional 4.9% |
| Austrians | 99.3 /100 | #45 | Exceptional 4.9% |
| Immigrants | Bulgaria | 99.3 /100 | #46 | Exceptional 4.9% |
| Okinawans | 99.3 /100 | #47 | Exceptional 4.9% |
| Thais | 99.2 /100 | #48 | Exceptional 4.9% |
| Australians | 99.2 /100 | #49 | Exceptional 4.9% |
Demographics Similar to Moroccans by Female Unemployment
In terms of female unemployment, the demographic groups most similar to Moroccans are Immigrants from Lebanon (5.5%, a difference of 0.020%), Immigrants from Iran (5.5%, a difference of 0.030%), Immigrants from Cambodia (5.5%, a difference of 0.060%), Immigrants from Panama (5.5%, a difference of 0.080%), and Sierra Leonean (5.5%, a difference of 0.10%).
| Demographics | Rating | Rank | Female Unemployment |
| Immigrants | Peru | 5.9 /100 | #226 | Tragic 5.5% |
| Immigrants | Philippines | 5.3 /100 | #227 | Tragic 5.5% |
| Israelis | 4.8 /100 | #228 | Tragic 5.5% |
| Panamanians | 4.7 /100 | #229 | Tragic 5.5% |
| Immigrants | Uruguay | 4.7 /100 | #230 | Tragic 5.5% |
| Immigrants | Iraq | 3.9 /100 | #231 | Tragic 5.5% |
| Liberians | 3.9 /100 | #232 | Tragic 5.5% |
| Moroccans | 3.4 /100 | #233 | Tragic 5.5% |
| Immigrants | Lebanon | 3.3 /100 | #234 | Tragic 5.5% |
| Immigrants | Iran | 3.3 /100 | #235 | Tragic 5.5% |
| Immigrants | Cambodia | 3.3 /100 | #236 | Tragic 5.5% |
| Immigrants | Panama | 3.2 /100 | #237 | Tragic 5.5% |
| Sierra Leoneans | 3.2 /100 | #238 | Tragic 5.5% |
| Aleuts | 3.0 /100 | #239 | Tragic 5.5% |
| Immigrants | South America | 2.9 /100 | #240 | Tragic 5.5% |