Immigrants from Canada vs Moroccan Births to Unmarried Women
COMPARE
Immigrants from Canada
Moroccan
Births to Unmarried Women
Births to Unmarried Women Comparison
Immigrants from Canada
Moroccans
30.4%
BIRTHS TO UNMARRIED WOMEN
83.7/ 100
METRIC RATING
139th/ 347
METRIC RANK
31.8%
BIRTHS TO UNMARRIED WOMEN
45.7/ 100
METRIC RATING
180th/ 347
METRIC RANK
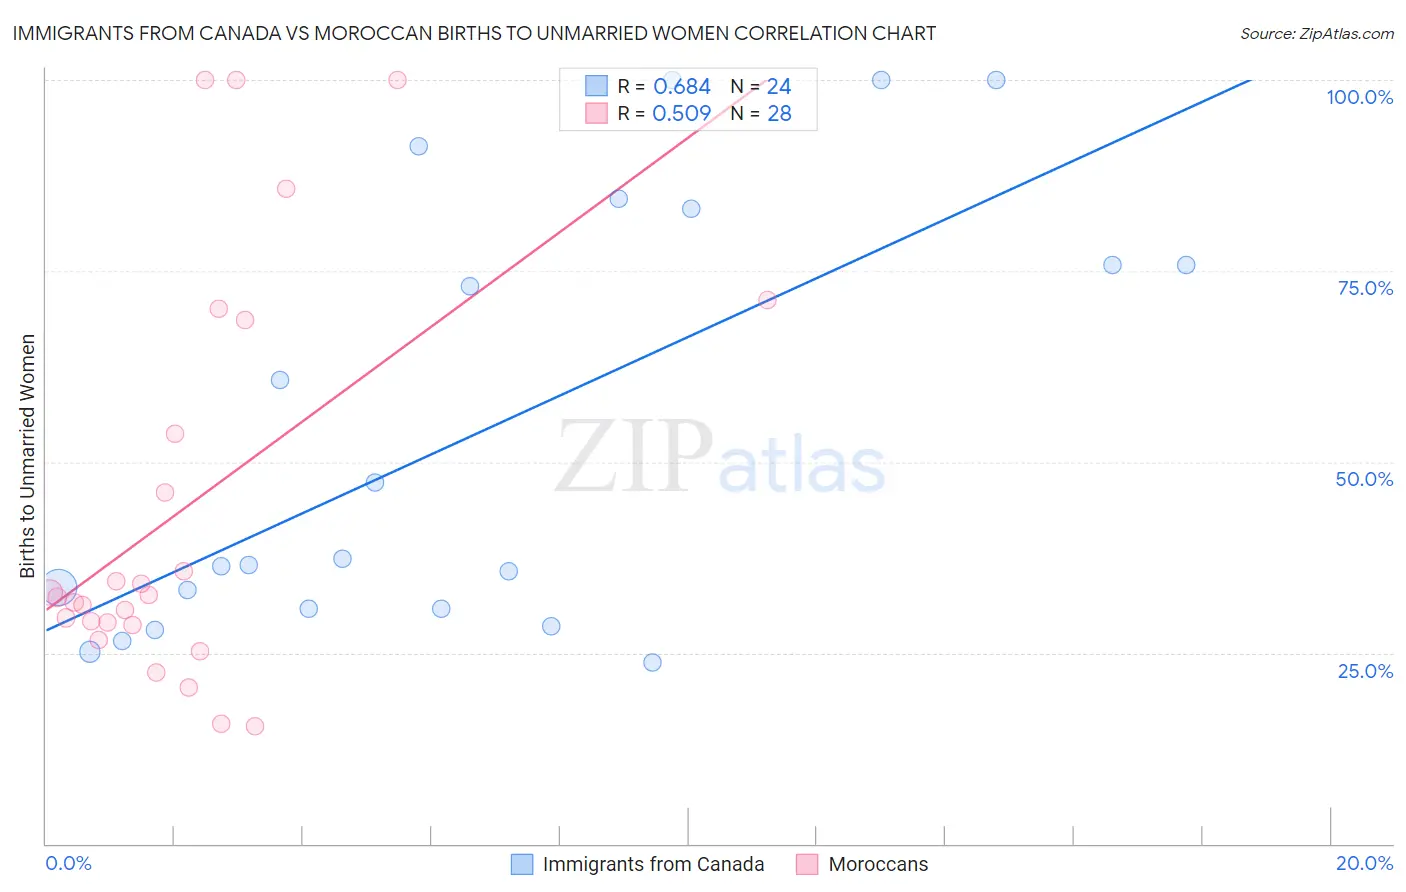
Immigrants from Canada vs Moroccan Births to Unmarried Women Correlation Chart
The statistical analysis conducted on geographies consisting of 419,760,568 people shows a significant positive correlation between the proportion of Immigrants from Canada and percentage of births to unmarried women in the United States with a correlation coefficient (R) of 0.684 and weighted average of 30.4%. Similarly, the statistical analysis conducted on geographies consisting of 194,487,713 people shows a substantial positive correlation between the proportion of Moroccans and percentage of births to unmarried women in the United States with a correlation coefficient (R) of 0.509 and weighted average of 31.8%, a difference of 4.4%.
Births to Unmarried Women Correlation Summary
| Measurement | Immigrants from Canada | Moroccan |
| Minimum | 23.8% | 15.3% |
| Maximum | 100.0% | 100.0% |
| Range | 76.2% | 84.7% |
| Mean | 54.1% | 44.0% |
| Median | 36.9% | 32.4% |
| Interquartile 25% (IQ1) | 30.8% | 28.8% |
| Interquartile 75% (IQ3) | 79.4% | 61.1% |
| Interquartile Range (IQR) | 48.7% | 32.3% |
| Standard Deviation (Sample) | 27.9% | 26.2% |
| Standard Deviation (Population) | 27.3% | 25.8% |
Similar Demographics by Births to Unmarried Women
Demographics Similar to Immigrants from Canada by Births to Unmarried Women
In terms of births to unmarried women, the demographic groups most similar to Immigrants from Canada are Puget Sound Salish (30.4%, a difference of 0.030%), Immigrants from Philippines (30.4%, a difference of 0.040%), Swiss (30.5%, a difference of 0.11%), Pakistani (30.5%, a difference of 0.13%), and Immigrants from Scotland (30.4%, a difference of 0.16%).
| Demographics | Rating | Rank | Births to Unmarried Women |
| New Zealanders | 85.5 /100 | #132 | Excellent 30.3% |
| Immigrants | Morocco | 85.2 /100 | #133 | Excellent 30.4% |
| Immigrants | South Eastern Asia | 85.2 /100 | #134 | Excellent 30.4% |
| Brazilians | 84.8 /100 | #135 | Excellent 30.4% |
| Immigrants | Scotland | 84.6 /100 | #136 | Excellent 30.4% |
| Immigrants | Philippines | 83.9 /100 | #137 | Excellent 30.4% |
| Puget Sound Salish | 83.9 /100 | #138 | Excellent 30.4% |
| Immigrants | Canada | 83.7 /100 | #139 | Excellent 30.4% |
| Swiss | 83.1 /100 | #140 | Excellent 30.5% |
| Pakistanis | 83.0 /100 | #141 | Excellent 30.5% |
| South Africans | 82.7 /100 | #142 | Excellent 30.5% |
| Immigrants | Uganda | 82.6 /100 | #143 | Excellent 30.5% |
| Czechs | 82.1 /100 | #144 | Excellent 30.5% |
| Immigrants | North America | 81.5 /100 | #145 | Excellent 30.6% |
| Northern Europeans | 81.4 /100 | #146 | Excellent 30.6% |
Demographics Similar to Moroccans by Births to Unmarried Women
In terms of births to unmarried women, the demographic groups most similar to Moroccans are Immigrants from Peru (31.8%, a difference of 0.060%), South American (31.8%, a difference of 0.11%), English (31.7%, a difference of 0.15%), South American Indian (31.7%, a difference of 0.18%), and Scottish (31.7%, a difference of 0.22%).
| Demographics | Rating | Rank | Births to Unmarried Women |
| Immigrants | Yemen | 50.2 /100 | #173 | Average 31.7% |
| Venezuelans | 50.0 /100 | #174 | Average 31.7% |
| Immigrants | Venezuela | 49.2 /100 | #175 | Average 31.7% |
| Scottish | 48.1 /100 | #176 | Average 31.7% |
| South American Indians | 47.7 /100 | #177 | Average 31.7% |
| English | 47.4 /100 | #178 | Average 31.7% |
| South Americans | 46.9 /100 | #179 | Average 31.8% |
| Moroccans | 45.7 /100 | #180 | Average 31.8% |
| Immigrants | Peru | 45.1 /100 | #181 | Average 31.8% |
| Kenyans | 43.0 /100 | #182 | Average 31.9% |
| Canadians | 41.4 /100 | #183 | Average 31.9% |
| Immigrants | South America | 40.7 /100 | #184 | Average 32.0% |
| Germans | 39.5 /100 | #185 | Fair 32.0% |
| Welsh | 38.2 /100 | #186 | Fair 32.0% |
| Czechoslovakians | 38.0 /100 | #187 | Fair 32.0% |