Immigrants from Canada vs New Zealander Female Unemployment
COMPARE
Immigrants from Canada
New Zealander
Female Unemployment
Female Unemployment Comparison
Immigrants from Canada
New Zealanders
4.9%
FEMALE UNEMPLOYMENT
98.6/ 100
METRIC RATING
61st/ 347
METRIC RANK
5.0%
FEMALE UNEMPLOYMENT
97.4/ 100
METRIC RATING
80th/ 347
METRIC RANK
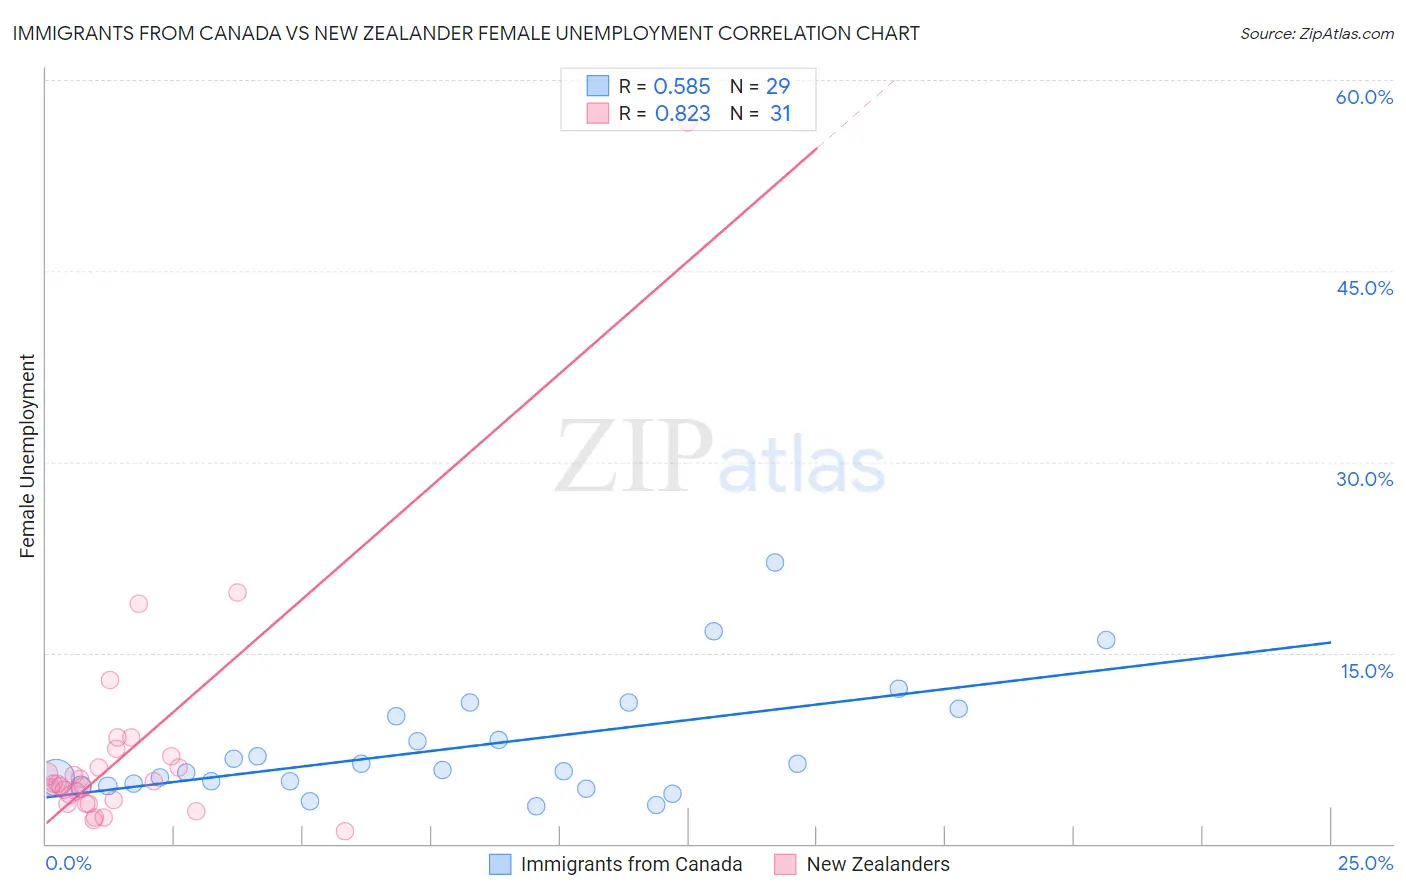
Immigrants from Canada vs New Zealander Female Unemployment Correlation Chart
The statistical analysis conducted on geographies consisting of 455,102,288 people shows a substantial positive correlation between the proportion of Immigrants from Canada and unemploymnet rate among females in the United States with a correlation coefficient (R) of 0.585 and weighted average of 4.9%. Similarly, the statistical analysis conducted on geographies consisting of 106,766,859 people shows a very strong positive correlation between the proportion of New Zealanders and unemploymnet rate among females in the United States with a correlation coefficient (R) of 0.823 and weighted average of 5.0%, a difference of 1.0%.
Female Unemployment Correlation Summary
| Measurement | Immigrants from Canada | New Zealander |
| Minimum | 2.9% | 1.0% |
| Maximum | 22.1% | 56.7% |
| Range | 19.2% | 55.7% |
| Mean | 7.6% | 7.4% |
| Median | 5.8% | 4.7% |
| Interquartile 25% (IQ1) | 4.6% | 3.2% |
| Interquartile 75% (IQ3) | 10.3% | 6.9% |
| Interquartile Range (IQR) | 5.7% | 3.7% |
| Standard Deviation (Sample) | 4.5% | 10.1% |
| Standard Deviation (Population) | 4.5% | 9.9% |
Demographics Similar to Immigrants from Canada and New Zealanders by Female Unemployment
In terms of female unemployment, the demographic groups most similar to Immigrants from Canada are Immigrants from Nepal (4.9%, a difference of 0.0%), Immigrants from Scotland (4.9%, a difference of 0.010%), Immigrants from Belgium (4.9%, a difference of 0.12%), Celtic (4.9%, a difference of 0.12%), and Immigrants from North America (4.9%, a difference of 0.31%). Similarly, the demographic groups most similar to New Zealanders are Turkish (5.0%, a difference of 0.12%), Mongolian (5.0%, a difference of 0.30%), Immigrants from Netherlands (5.0%, a difference of 0.30%), Immigrants from Singapore (5.0%, a difference of 0.40%), and Immigrants from Venezuela (5.0%, a difference of 0.40%).
| Demographics | Rating | Rank | Female Unemployment |
| Immigrants | Scotland | 98.6 /100 | #60 | Exceptional 4.9% |
| Immigrants | Canada | 98.6 /100 | #61 | Exceptional 4.9% |
| Immigrants | Nepal | 98.6 /100 | #62 | Exceptional 4.9% |
| Immigrants | Belgium | 98.5 /100 | #63 | Exceptional 4.9% |
| Celtics | 98.5 /100 | #64 | Exceptional 4.9% |
| Immigrants | North America | 98.3 /100 | #65 | Exceptional 4.9% |
| Hungarians | 98.3 /100 | #66 | Exceptional 4.9% |
| Cubans | 98.3 /100 | #67 | Exceptional 4.9% |
| Tlingit-Haida | 98.3 /100 | #68 | Exceptional 4.9% |
| Immigrants | Ireland | 98.2 /100 | #69 | Exceptional 4.9% |
| Osage | 98.2 /100 | #70 | Exceptional 4.9% |
| German Russians | 98.1 /100 | #71 | Exceptional 4.9% |
| Immigrants | Northern Europe | 98.0 /100 | #72 | Exceptional 4.9% |
| Russians | 98.0 /100 | #73 | Exceptional 5.0% |
| Immigrants | Bolivia | 98.0 /100 | #74 | Exceptional 5.0% |
| Immigrants | Singapore | 98.0 /100 | #75 | Exceptional 5.0% |
| Immigrants | Venezuela | 97.9 /100 | #76 | Exceptional 5.0% |
| Mongolians | 97.8 /100 | #77 | Exceptional 5.0% |
| Immigrants | Netherlands | 97.8 /100 | #78 | Exceptional 5.0% |
| Turks | 97.6 /100 | #79 | Exceptional 5.0% |
| New Zealanders | 97.4 /100 | #80 | Exceptional 5.0% |