Welsh vs Moroccan Female Unemployment
COMPARE
Welsh
Moroccan
Female Unemployment
Female Unemployment Comparison
Welsh
Moroccans
4.7%
FEMALE UNEMPLOYMENT
99.9/ 100
METRIC RATING
24th/ 347
METRIC RANK
5.5%
FEMALE UNEMPLOYMENT
3.4/ 100
METRIC RATING
233rd/ 347
METRIC RANK
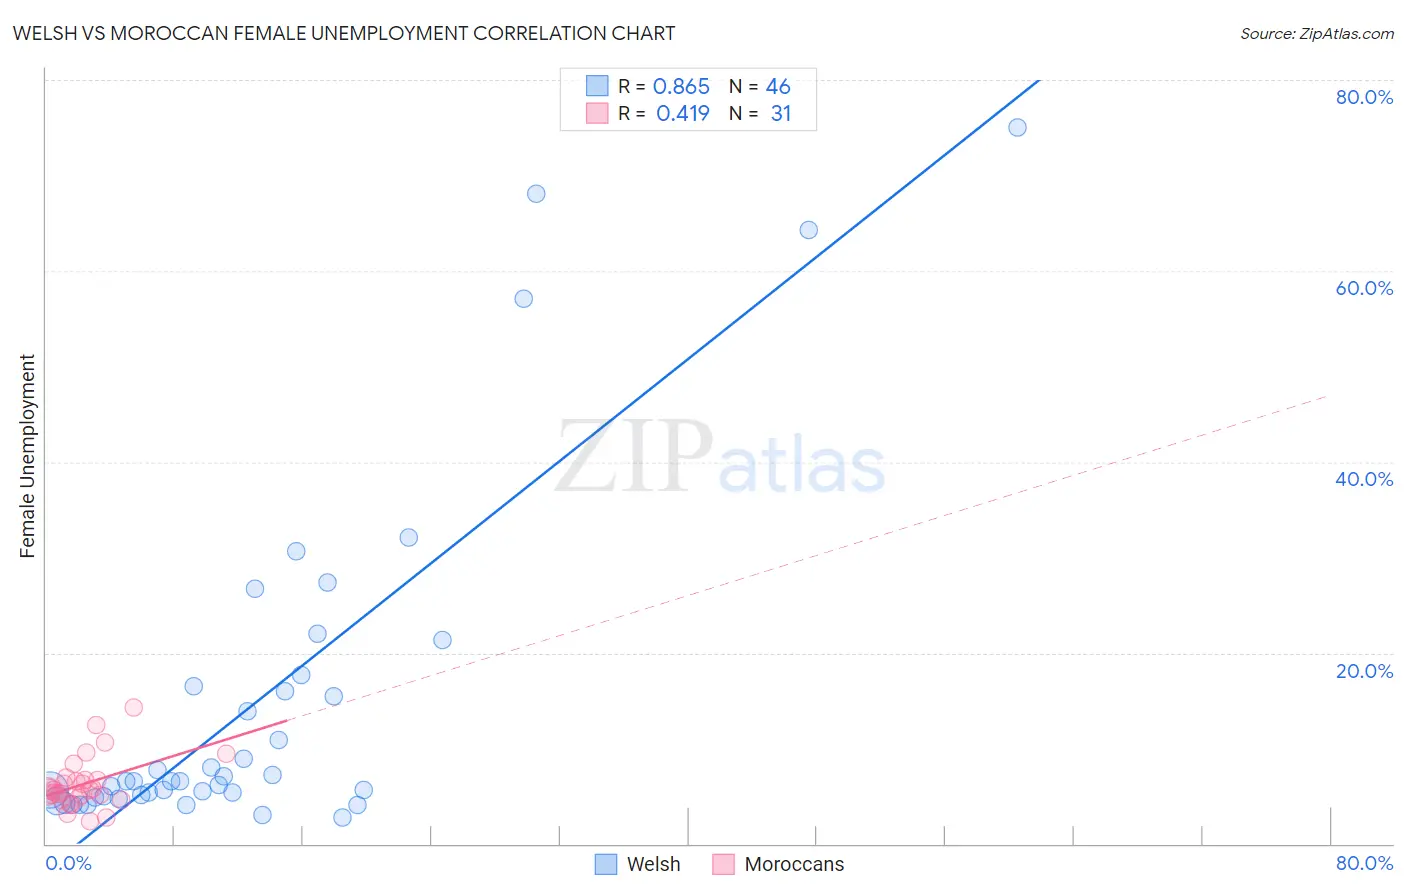
Welsh vs Moroccan Female Unemployment Correlation Chart
The statistical analysis conducted on geographies consisting of 519,058,145 people shows a very strong positive correlation between the proportion of Welsh and unemploymnet rate among females in the United States with a correlation coefficient (R) of 0.865 and weighted average of 4.7%. Similarly, the statistical analysis conducted on geographies consisting of 201,565,511 people shows a moderate positive correlation between the proportion of Moroccans and unemploymnet rate among females in the United States with a correlation coefficient (R) of 0.419 and weighted average of 5.5%, a difference of 16.9%.
Female Unemployment Correlation Summary
| Measurement | Welsh | Moroccan |
| Minimum | 2.8% | 2.3% |
| Maximum | 75.0% | 14.3% |
| Range | 72.2% | 11.9% |
| Mean | 14.8% | 6.3% |
| Median | 6.5% | 5.6% |
| Interquartile 25% (IQ1) | 5.0% | 4.8% |
| Interquartile 75% (IQ3) | 16.5% | 6.7% |
| Interquartile Range (IQR) | 11.5% | 1.9% |
| Standard Deviation (Sample) | 17.8% | 2.7% |
| Standard Deviation (Population) | 17.7% | 2.6% |
Similar Demographics by Female Unemployment
Demographics Similar to Welsh by Female Unemployment
In terms of female unemployment, the demographic groups most similar to Welsh are Immigrants from India (4.7%, a difference of 0.090%), Immigrants from Bosnia and Herzegovina (4.7%, a difference of 0.13%), Scottish (4.7%, a difference of 0.21%), British (4.7%, a difference of 0.29%), and Irish (4.7%, a difference of 0.32%).
| Demographics | Rating | Rank | Female Unemployment |
| Croatians | 99.9 /100 | #17 | Exceptional 4.7% |
| Latvians | 99.9 /100 | #18 | Exceptional 4.7% |
| Poles | 99.9 /100 | #19 | Exceptional 4.7% |
| Bulgarians | 99.9 /100 | #20 | Exceptional 4.7% |
| Fijians | 99.9 /100 | #21 | Exceptional 4.7% |
| Europeans | 99.9 /100 | #22 | Exceptional 4.7% |
| Scottish | 99.9 /100 | #23 | Exceptional 4.7% |
| Welsh | 99.9 /100 | #24 | Exceptional 4.7% |
| Immigrants | India | 99.9 /100 | #25 | Exceptional 4.7% |
| Immigrants | Bosnia and Herzegovina | 99.9 /100 | #26 | Exceptional 4.7% |
| British | 99.9 /100 | #27 | Exceptional 4.7% |
| Irish | 99.9 /100 | #28 | Exceptional 4.7% |
| Cypriots | 99.9 /100 | #29 | Exceptional 4.7% |
| Lithuanians | 99.8 /100 | #30 | Exceptional 4.7% |
| Sudanese | 99.8 /100 | #31 | Exceptional 4.8% |
Demographics Similar to Moroccans by Female Unemployment
In terms of female unemployment, the demographic groups most similar to Moroccans are Immigrants from Lebanon (5.5%, a difference of 0.020%), Immigrants from Iran (5.5%, a difference of 0.030%), Immigrants from Cambodia (5.5%, a difference of 0.060%), Immigrants from Panama (5.5%, a difference of 0.080%), and Sierra Leonean (5.5%, a difference of 0.10%).
| Demographics | Rating | Rank | Female Unemployment |
| Immigrants | Peru | 5.9 /100 | #226 | Tragic 5.5% |
| Immigrants | Philippines | 5.3 /100 | #227 | Tragic 5.5% |
| Israelis | 4.8 /100 | #228 | Tragic 5.5% |
| Panamanians | 4.7 /100 | #229 | Tragic 5.5% |
| Immigrants | Uruguay | 4.7 /100 | #230 | Tragic 5.5% |
| Immigrants | Iraq | 3.9 /100 | #231 | Tragic 5.5% |
| Liberians | 3.9 /100 | #232 | Tragic 5.5% |
| Moroccans | 3.4 /100 | #233 | Tragic 5.5% |
| Immigrants | Lebanon | 3.3 /100 | #234 | Tragic 5.5% |
| Immigrants | Iran | 3.3 /100 | #235 | Tragic 5.5% |
| Immigrants | Cambodia | 3.3 /100 | #236 | Tragic 5.5% |
| Immigrants | Panama | 3.2 /100 | #237 | Tragic 5.5% |
| Sierra Leoneans | 3.2 /100 | #238 | Tragic 5.5% |
| Aleuts | 3.0 /100 | #239 | Tragic 5.5% |
| Immigrants | South America | 2.9 /100 | #240 | Tragic 5.5% |